Remove Data Preparation Remove Data Visualization Remove Power BI
article thumbnail

Transform your data into insights: The data analyst’s guide to Power BI

Data Science Dojo

Data is an essential component of any business, and it is the role of a data analyst to make sense of it all. Power BI is a powerful data visualization tool that helps them turn raw data into meaningful insights and actionable decisions.


Power BI 221
article thumbnail

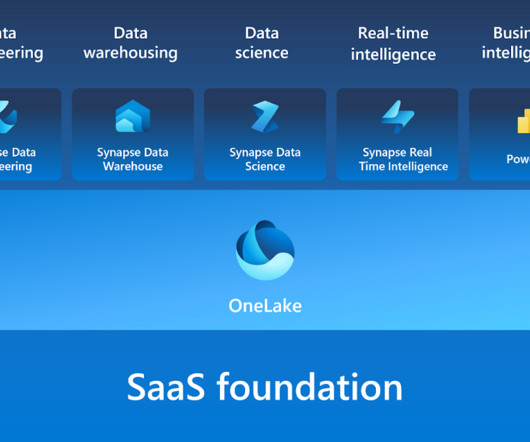
Exploring the Power of Microsoft Fabric: A Hands-On Guide with a Sales Use Case

Data Science Dojo

In the sales context, this ensures that sales data remains consistent, accurate, and easily accessible for analysis and reporting. Synapse Data Science: Synapse Data Science empowers data scientists to work directly with secured and governed sales data prepared by engineering teams, allowing for the efficient development of predictive models.

Power BI 337
professionals

Sign Up for our Newsletter

This site is protected by reCAPTCHA and the Google Privacy Policy and Terms of Service apply.

article thumbnail

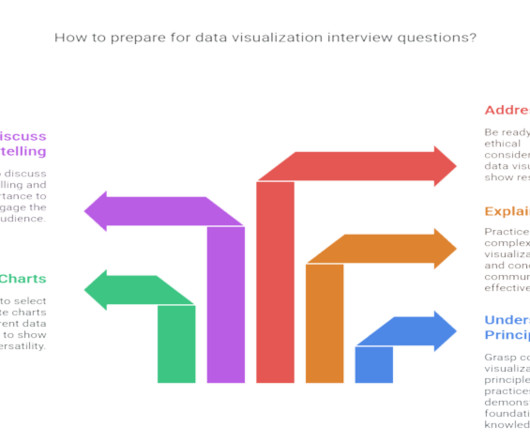
Ace Your Interview: Top 10 Data Visualization Questions and Answers (Beginner & Advanced)

Pickl AI

Summary : Prepare for your data visualization interview with our guide to the top questions and answers. Introduction Data visualization is no longer just a niche skill; it’s a fundamental component of Data Analysis , business intelligence, and data science.

article thumbnail

Augmented analytics

Dataconomy

This technological advancement not only empowers data analysts but also enables non-technical users to engage with data effortlessly, paving the way for enhanced insights and agile strategies. Augmented analytics is the integration of ML and NLP technologies aimed at automating several aspects of data preparation and analysis.

article thumbnail

Future-Forward: 2024’s Most Promising Power BI Project Ideas

Pickl AI

Summary: This blog dives into the most promising Power BI projects, exploring advanced data visualization, AI integration, IoT & blockchain analytics, and emerging technologies. Discover best practices for successful implementation and propel your organization towards data-driven success.

article thumbnail

Leveraging KNIME and Power BI: Integrating Power BI in KNIME

phData

Consequently, the tools we employ to process and visualize this data play a critical role. Among these tools, KNIME and Power BI have emerged as key players, catering to the demands of this evolving landscape. In this blog, we will focus on integrating Power BI within KNIME for enhanced data analytics.

article thumbnail

5 Free Data Visualization Tools to Showcase Your Data in 2024

ODSC - Open Data Science

In the world of data visualization , the ability to produce material that can speak to your audience, regardless of their technical expertise, is an ever-important factor to consider. Tableau Public Tableau Public , a powerful data visualization software, empowers users to create interactive and shareable dashboards with ease.