This site uses cookies to improve your experience. To help us insure we adhere to various privacy regulations, please select your country/region of residence. If you do not select a country, we will assume you are from the United States. Select your Cookie Settings or view our Privacy Policy and Terms of Use.
Cookie Settings
Cookies and similar technologies are used on this website for proper function of the website, for tracking performance analytics and for marketing purposes. We and some of our third-party providers may use cookie data for various purposes. Please review the cookie settings below and choose your preference.
Used for the proper function of the website
Used for monitoring website traffic and interactions
Cookie Settings
Cookies and similar technologies are used on this website for proper function of the website, for tracking performance analytics and for marketing purposes. We and some of our third-party providers may use cookie data for various purposes. Please review the cookie settings below and choose your preference.
Strictly Necessary: Used for the proper function of the website
Performance/Analytics: Used for monitoring website traffic and interactions
What exactly is DataOps ? The term has been used a lot more of late, especially in the data analytics industry, as we’ve seen it expand over the past few years to keep pace with new regulations, like the GDPR and CCPA. In essence, DataOps is a practice that helps organizations manage and govern data more effectively.
The audience grew to include datascientists (who were even more scarce and expensive) and their supporting resources (e.g., ML and DataOps teams). After that came data governance , privacy, and compliance staff. Power business users and other non-purely-analytic data citizens came after that.
Access to high-qualitydata can help organizations start successful products, defend against digital attacks, understand failures and pivot toward success. Emerging technologies and trends, such as machine learning (ML), artificial intelligence (AI), automation and generative AI (gen AI), all rely on good dataquality.
For some time now, data observabilit y has been an important factor in software engineering, but its application within the realm of data stewardship is a relatively new phenomenon. Data observability is a foundational element of data operations (DataOps). Data observability helps you manage dataquality at scale.
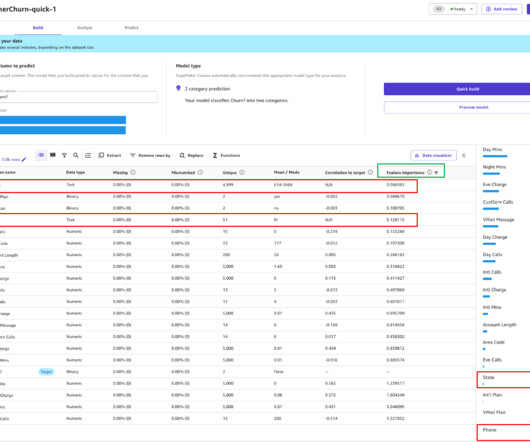
It also enables you to evaluate the models using advanced metrics as if you were a datascientist. We explain the metrics and show techniques to deal with data to obtain better model performance. For a column impact of 25%, Canvas weighs the prediction as 25% for the column and 75% for the other columns.
Data domain teams have a better understanding of the data and their unique use cases, making them better positioned to enhance the value of their data and make it available for data teams. With this approach, demands on each team are more manageable, and analysts can quickly get the data they need.
We organize all of the trending information in your field so you don't have to. Join 17,000+ users and stay up to date on the latest articles your peers are reading.
You know about us, now we want to get to know you!
Let's personalize your content
Let's get even more personalized
We recognize your account from another site in our network, please click 'Send Email' below to continue with verifying your account and setting a password.


Let's personalize your content