This site uses cookies to improve your experience. To help us insure we adhere to various privacy regulations, please select your country/region of residence. If you do not select a country, we will assume you are from the United States. Select your Cookie Settings or view our Privacy Policy and Terms of Use.
Cookie Settings
Cookies and similar technologies are used on this website for proper function of the website, for tracking performance analytics and for marketing purposes. We and some of our third-party providers may use cookie data for various purposes. Please review the cookie settings below and choose your preference.
Used for the proper function of the website
Used for monitoring website traffic and interactions
Cookie Settings
Cookies and similar technologies are used on this website for proper function of the website, for tracking performance analytics and for marketing purposes. We and some of our third-party providers may use cookie data for various purposes. Please review the cookie settings below and choose your preference.
Strictly Necessary: Used for the proper function of the website
Performance/Analytics: Used for monitoring website traffic and interactions
There is no disputing the fact that the collection and analysis of massive amounts of unstructured data has been a huge breakthrough. We would like to talk about datavisualization and its role in the big data movement. Data is useless without the opportunity to visualize what we are looking for.
Implementing DBSCAN in Python • How to Avoid Overfitting • Simplify Data Processing with Pandas Pipeline • How to Use DataVisualization to Add Impact to Your Work Reports and Presentations • The DataQuality Hierarchy of Needs.
In retail, complete and consistent data is necessary to understand customer behavior and optimize sales strategies. Without data fidelity, decision-makers cannot rely on data insights to make informed decisions. Poor dataquality can result in wasted resources, inaccurate conclusions, and lost opportunities.
It advocates decentralizing data ownership to domain-oriented teams. Each team becomes responsible for its Data Products , and a self-serve data infrastructure is established. This enables scalability, agility, and improved dataquality while promoting data democratization.
These tools provide data engineers with the necessary capabilities to efficiently extract, transform, and load (ETL) data, build data pipelines, and prepare data for analysis and consumption by other applications. Essential data engineering tools for 2023 Top 10 data engineering tools to watch out for in 2023 1.
Key features of augmented analytics A variety of features distinguish augmented analytics from traditional data analytics models. Smart data preparation Automated data cleaning is a crucial part of augmented analytics. It involves processes that improve dataquality, such as removing duplicates and addressing inconsistencies.
In retail, complete and consistent data is necessary to understand customer behavior and optimize sales strategies. Without data fidelity, decision-makers cannot rely on data insights to make informed decisions. Poor dataquality can result in wasted resources, inaccurate conclusions, and lost opportunities.
To help you identify and resolve these mistakes, we’ve put together this guide on the various big data mistakes that marketers tend to make. Big Data Mistakes You Must Avoid. Here are some common big data mistakes you must avoid to ensure that your campaigns aren’t affected. Ignoring DataQuality.
Are you an aspiring data scientist , or just want to understand the benefits of integrating data catalogs with visualization tools? In today’s ever-growing world of data, having an easy way to gain insights quickly is essential. It helps them effectively capture, store, manage, and share data assets.
While machine learning frameworks and platforms like PyTorch, TensorFlow, and scikit-learn can perform data exploration well, it’s not their primary intent. There are also plenty of datavisualization libraries available that can handle exploration like Plotly, matplotlib, D3, Apache ECharts, Bokeh, etc.
Here are some of the key types of cloud analytics: Descriptive analytics: This type focuses on summarizing historical data to provide insights into what has happened in the past. It helps organizations understand trends, patterns, and anomalies in their data.
Link to event -> Generative AI and Data Storytelling Here are some of the key takeaways from the article: Generative AI is a type of artificial intelligence that can create new content, such as text, images, and music. Data storytelling is the process of using data to communicate a story in a way that is engaging and informative.
Are you an aspiring data scientist , or just want to understand the benefits of integrating data catalogs with visualization tools? In today’s ever-growing world of data, having an easy way to gain insights quickly is essential. It helps them effectively capture, store, manage, and share data assets.
You can finally understand what you’re looking at and what the data is saying. The format can be classified by size, but you can choose to organize data horizontally or vertically/by column. It doesn’t matter if you use graphs or charts, you need to get better at datavisualization. Metadata makes the task a lot easier.
This could include dataquality checks, alerts, and notifications. Establish data governance: Establish clear data governance policies to ensure that your data is accurate, complete, and accessible. Invest in analytics tools: Invest in tools and processes to help you analyze and understand your data effectively.
They employ statistical and mathematical techniques to uncover patterns, trends, and relationships within the data. Data scientists possess a deep understanding of statistical modeling, datavisualization, and exploratory data analysis to derive actionable insights and drive business decisions.
Using the services built-in source connectors standardizes and simplifies the work needed to maintain dataquality and manage the overall data lifecycle. He has worked on a variety of products, including datavisualization tools and mobile applications. Jonathan Garcia is a Sr.
To democratize data, organizations need to provide people with the tools and resources they need to access, analyze, and draw insights from data. The ultimate goal of data democratization is to create a more open and transparent culture around data, where everyone has access to the information they need to make informed decisions.
Summary: Business Intelligence Analysts transform raw data into actionable insights. They use tools and techniques to analyse data, create reports, and support strategic decisions. Key skills include SQL, datavisualization, and business acumen. Introduction We are living in an era defined by data.
Machine learning practitioners are often working with data at the beginning and during the full stack of things, so they see a lot of workflow/pipeline development, data wrangling, and data preparation. Some of the issues make perfect sense as they relate to dataquality, with common issues being bad/unclean data and data bias.
Data Observability and DataQuality are two key aspects of data management. The focus of this blog is going to be on Data Observability tools and their key framework. The growing landscape of technology has motivated organizations to adopt newer ways to harness the power of data. What is Data Observability?
Address common challenges in managing SAP master data by using AI tools to automate SAP processes and ensure dataquality. Create an AI-driven data and process improvement loop to continuously enhance your business operations. Think about material master data, for example. Data creation and management processes.
This data is then integrated into centralized databases for further processing and analysis. Data Cleaning and Preprocessing IoT data can be noisy, incomplete, and inconsistent. Data engineers employ data cleaning and preprocessing techniques to ensure dataquality, making it ready for analysis and decision-making.
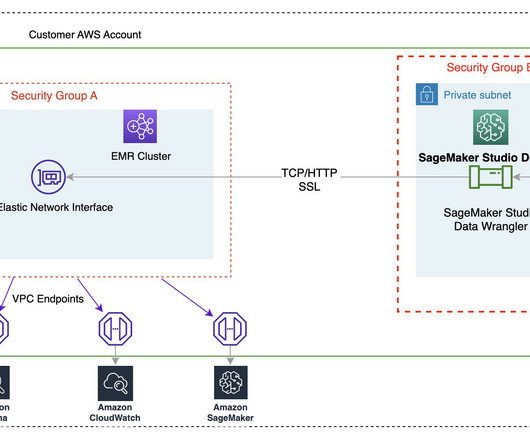
We also detail the steps that data scientists can take to configure the data flow, analyze the dataquality, and add data transformations. Finally, we show how to export the data flow and train a model using SageMaker Autopilot. On the Studio Home page, choose Import & prepare datavisually.
They also explore the technical aspects of chunking strategies and dataquality in RAG systems. Hayley121995 is looking for data scientists and ML enthusiasts to join their AI research projects. They are looking for someone proficient in datavisualization, machine learning, and data labeling.
An enterprise data catalog does all that a library inventory system does – namely streamlining data discovery and access across data sources – and a lot more. For example, data catalogs have evolved to deliver governance capabilities like managing dataquality and data privacy and compliance.
Data collection from smart meters, weather stations, and sensors empowers us to predict energy demand and production. Datavisualization tools translate complex data into clear visuals, fostering stakeholder engagement and driving progress towards a clean energy future. The world is facing a critical juncture.
The dataset includes a wide variety of natural images paired with detailed instructions and high-quality responses. It requires sophisticated visual reasoning to interpret datavisualizations and answer numerical and analytical questions about the presented information. 11B and Meta Llama 3.2
Establishing a foundation of trust: Dataquality and governance for enterprise AI As organizations increasingly rely on artificial intelligence (AI) to drive critical decision-making, the importance of dataquality and governance cannot be overstated.
To democratize data, organizations need to provide people with the tools and resources they need to access, analyze, and draw insights from data. The ultimate goal of data democratization is to create a more open and transparent culture around data, where everyone has access to the information they need to make informed decisions.
It combines techniques from mathematics, statistics, computer science, and domain expertise to analyze data, draw conclusions, and forecast future trends. Data scientists use a combination of programming languages (Python, R, etc.), Acquiring and maintaining this breadth of knowledge can be challenging and time-consuming.
Proficient in programming languages like Python or R, data manipulation libraries like Pandas, and machine learning frameworks like TensorFlow and Scikit-learn, data scientists uncover patterns and trends through statistical analysis and datavisualization. DataVisualization: Matplotlib, Seaborn, Tableau, etc.
Data Pipeline Use Cases Here are just a few examples of the goals you can achieve with a robust data pipeline: Data Prep for VisualizationData pipelines can facilitate easier datavisualization by gathering and transforming the necessary data into a usable state.
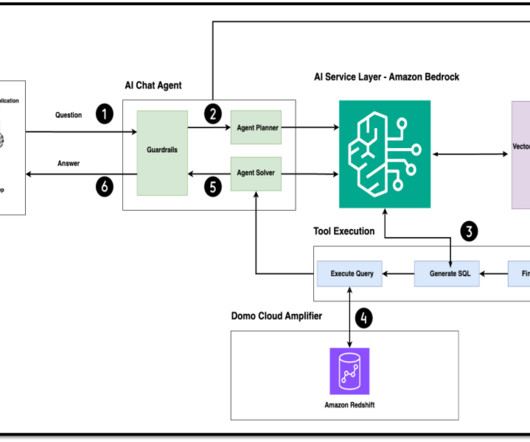
Generative artificial intelligence (AI) has revolutionized this by allowing users to interact with data through natural language queries, providing instant insights and visualizations without needing technical expertise. This can democratize data access and speed up analysis.
Descriptive analytics is a fundamental method that summarizes past data using tools like Excel or SQL to generate reports. Techniques such as data cleansing, aggregation, and trend analysis play a critical role in ensuring dataquality and relevance. Data Scientists rely on technical proficiency.
Some common data strategy goals of an ACE include improving dataquality and governance, enhancing data-driven decision-making, increasing efficiency and productivity, and establishing a culture of data-driven thinking throughout the organization.
With over 97% of businesses reporting improved decision-making through datavisualization, the impact of effective dashboards is undeniable. For instance, a marketing dashboard can track campaign performance, revealing that companies using data-driven strategies are six times more likely to be profitable than their competitors.
Analytics, by contrast, remains invaluable for deriving insights from data, especially when predictive models aren’t necessary. For tasks like understanding business performance or uncovering correlations, traditional analytics methods—such as statistical analysis and datavisualization—are often more straightforward and cost-effective.
Summary: Data preprocessing in Python is essential for transforming raw data into a clean, structured format suitable for analysis. It involves steps like handling missing values, normalizing data, and managing categorical features, ultimately enhancing model performance and ensuring dataquality.
As you’ll see below, however, a growing number of data analytics platforms, skills, and frameworks have altered the traditional view of what a data analyst is. Data Presentation: Communication Skills, DataVisualization Any good data analyst can go beyond just number crunching.
It is popular for its powerful datavisualization and analysis capabilities. Hence, Data Scientists rely on R to perform complex statistical operations. With a wide array of packages like ggplot2 and dplyr, R allows for sophisticated datavisualization and efficient data manipulation. Wrapping it up !!!
To get ready for modeling or reporting, they can visually analyze the database, tables, schema, and author Hive queries to create the ML dataset. Then, they can quickly profile data using Data Wrangler visual interface to evaluate dataquality, spot anomalies and missing or incorrect data, and get advice on how to deal with these problems.
And our unique approach to data management provides valuable metadata, lineage, and dataquality alerts right in the flow of users’ analysis, while providing the security and governance you need. This means increased transparency and trust in data, so everyone has the right data at the right time for making decisions.
How to become a data scientist Data transformation also plays a crucial role in dealing with varying scales of features, enabling algorithms to treat each feature equally during analysis Noise reduction As part of data preprocessing, reducing noise is vital for enhancing dataquality.
We organize all of the trending information in your field so you don't have to. Join 17,000+ users and stay up to date on the latest articles your peers are reading.
You know about us, now we want to get to know you!
Let's personalize your content
Let's get even more personalized
We recognize your account from another site in our network, please click 'Send Email' below to continue with verifying your account and setting a password.


Let's personalize your content