This site uses cookies to improve your experience. To help us insure we adhere to various privacy regulations, please select your country/region of residence. If you do not select a country, we will assume you are from the United States. Select your Cookie Settings or view our Privacy Policy and Terms of Use.
Cookie Settings
Cookies and similar technologies are used on this website for proper function of the website, for tracking performance analytics and for marketing purposes. We and some of our third-party providers may use cookie data for various purposes. Please review the cookie settings below and choose your preference.
Used for the proper function of the website
Used for monitoring website traffic and interactions
Cookie Settings
Cookies and similar technologies are used on this website for proper function of the website, for tracking performance analytics and for marketing purposes. We and some of our third-party providers may use cookie data for various purposes. Please review the cookie settings below and choose your preference.
Strictly Necessary: Used for the proper function of the website
Performance/Analytics: Used for monitoring website traffic and interactions
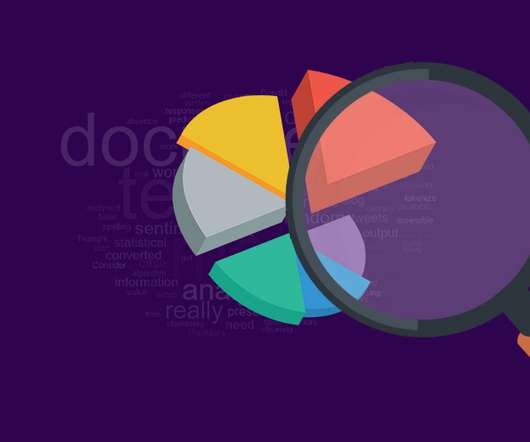
This article was published as a part of the DataScience Blogathon What is EDA(Exploratorydataanalysis)? Exploratorydataanalysis is a great way of understanding and analyzing the data sets.
ArticleVideo Book This article was published as a part of the DataScience Blogathon Overview Python Pandas library is becoming most popular between datascientists. The post EDA – ExploratoryDataAnalysis Using Python Pandas and SQL appeared first on Analytics Vidhya.
In this blog, we will discuss exploratorydataanalysis, also known as EDA, and why it is important. We will also be sharing code snippets so you can try out different analysis techniques yourself. This can be useful for identifying patterns and trends in the data. So, without any further ado let’s dive right in.
Are you curious about what it takes to become a professional datascientist? By following these guides, you can transform yourself into a skilled datascientist and unlock endless career opportunities. Look no further!
ChatGPT plugins can be used to extend the capabilities of ChatGPT in a variety of ways, such as: Accessing and processing external data Performing complex computations Using third-party services In this article, we’ll dive into the top 6 ChatGPT plugins tailored for datascience.
As datascience evolves and grows, the demand for skilled datascientists is also rising. A datascientist’s role is to extract insights and knowledge from data and to use this information to inform decisions and drive business growth.
Today’s question is, “What does a datascientist do.” ” Step into the realm of datascience, where numbers dance like fireflies and patterns emerge from the chaos of information. In this blog post, we’re embarking on a thrilling expedition to demystify the enigmatic role of datascientists.
Machine learning engineer vs datascientist: two distinct roles with overlapping expertise, each essential in unlocking the power of data-driven insights. As businesses strive to stay competitive and make data-driven decisions, the roles of machine learning engineers and datascientists have gained prominence.
As we delve into 2023, the realms of DataScience, Artificial Intelligence (AI), and Large Language Models (LLMs) continue to evolve at an unprecedented pace. Here are 7 types of distributions with intuitive examples that often occur in real-life data.
Introduction DataScience is one of the most promising careers of 2022 and beyond. Do you know that, for the past 5 years, ‘DataScientist’ consistently ranked among the top 3 job professions in the US market? Keeping this in mind, many working professionals and students have started upskilling themselves.
Shoppers probably dont realize how large a role datascience plays in retail. Those are just some of the insights that datascientist Vivek Anand extracts to inform decision makers at the Gap , a clothing company headquartered in San Francisco. But underneath they are similar.
Datascientists suffer needlessly when they don’t account for the time it takes to properly complete all of the steps of exploratorydataanalysis There’s a scourge terrorizing datascientists and datascience departments across the dataland.
Summary: Python for DataScience is crucial for efficiently analysing large datasets. Introduction Python for DataScience has emerged as a pivotal tool in the data-driven world. Key Takeaways Python’s simplicity makes it ideal for DataAnalysis. in 2022, according to the PYPL Index.
What is datascience? Datascience is analyzing and predicting data, It is an emerging field. Some of the applications of datascience are driverless cars, gaming AI, movie recommendations, and shopping recommendations. Datascientists use algorithms for creating data models.
Performing exploratorydataanalysis to gain insights into the dataset’s structure. Whether you’re a datascientist aiming to deepen your expertise in NLP or a machine learning engineer interested in domain-specific model fine-tuning, this tutorial will equip you with the tools and insights you need to get started.
Four Essential Tools Every DataScientist Should Have in Their Toolbox This member-only story is on us. Photo by Adam Śmigielski on Unsplash It’s a great time to be a datascientist! Last Updated on September 8, 2023 by Editorial Team Author(s): Francis Adrian Viernes Originally published on Towards AI.
From Solo Notebooks to Collaborative Powerhouse: VS Code Extensions for DataScience and ML Teams Photo by Parabol | The Agile Meeting Toolbox on Unsplash In this article, we will explore the essential VS Code extensions that enhance productivity and collaboration for datascientists and machine learning (ML) engineers.
7 types of statistical distributions with practical examples Statistical distributions help us understand a problem better by assigning a range of possible values to the variables, making them very useful in datascience and machine learning. Here are 7 types of distributions with intuitive examples that often occur in real-life data.
Google Releases a tool for Automated ExploratoryDataAnalysis Exploring data is one of the first activities a datascientist performs after getting access to the data. This command-line tool helps to determine the properties and quality of the data as well the predictive power.
Making visualizations is one of the finest ways for datascientists to explain dataanalysis to people outside the business. Exploratorydataanalysis can help you comprehend your data better, which can aid in future data preprocessing. ExploratoryDataAnalysis What is EDA?
Unlocking Time Series Insights: Dive into 5 Free and Practical Kaggle Notebooks to Kickstart Your Analysis Time series data is one of the most common data types in the industry, and you will probably be working with it in your career. Join thousands of data leaders on the AI newsletter.
There are also plenty of data visualization libraries available that can handle exploration like Plotly, matplotlib, D3, Apache ECharts, Bokeh, etc. In this article, we’re going to cover 11 data exploration tools that are specifically designed for exploration and analysis. Output is a fully self-contained HTML application.
This article seeks to also explain fundamental topics in datascience such as EDA automation, pipelines, ROC-AUC curve (how results will be evaluated), and Principal Component Analysis in a simple way. Act One: ExploratoryDataAnalysis — Automation The nuisance of repetitive tasks is something we programmers know all too well.
It is designed to make it easy to track and monitor experiments and conduct exploratorydataanalysis (EDA) using popular Python visualization frameworks. Introducing Kangas A powerful software application for working with large amounts of multimedia data. Please consider signing up using my referral link.
Summary: This blog provides a comprehensive roadmap for aspiring Azure DataScientists, outlining the essential skills, certifications, and steps to build a successful career in DataScience using Microsoft Azure.
Summary: The DataScience and DataAnalysis life cycles are systematic processes crucial for uncovering insights from raw data. Quality data is foundational for accurate analysis, ensuring businesses stay competitive in the digital landscape. billion INR by 2026, with a CAGR of 27.7%.
Tableau can help DataScientists generate graphs, charts, maps and data-driven stories, etc for purpose of visualisation and analysing data. But What is Tableau for DataScience and what are its advantages and disadvantages? ExploratoryDataAnalysis is one of the most important DataScience processes.
Answering one of the most common questions I get asked as a Senior DataScientist — What skills and educational background are necessary to become a datascientist? Photo by Eunice Lituañas on Unsplash To become a datascientist, a combination of technical skills and educational background is typically required.
Learn how DataScientists use ChatGPT, a potent OpenAI language model, to improve their operations. ChatGPT is essential in the domains of natural language processing, modeling, dataanalysis, data cleaning, and data visualization. It facilitates exploratoryDataAnalysis and provides quick insights.
Similar to traditional Machine Learning Ops (MLOps), LLMOps necessitates a collaborative effort involving datascientists, DevOps engineers, and IT professionals. Some projects may necessitate a comprehensive LLMOps approach, spanning tasks from data preparation to pipeline production.
DataScience is a popular as well as vast field; till date, there are a lot of opportunities in this field, and most people, whether they are working professionals or students, everyone want a transition in datascience because of its scope. What to do next?
Unfolding the difference between data engineer, datascientist, and data analyst. Data engineers are essential professionals responsible for designing, constructing, and maintaining an organization’s data infrastructure. Read more to know.
Due to the growing application of DataScience in different industries, companies are now looking forward to hiring individuals and training their employees on newer technologies that can eventually help the organization attain its goals. Best DataScience courses for working professionals 1.
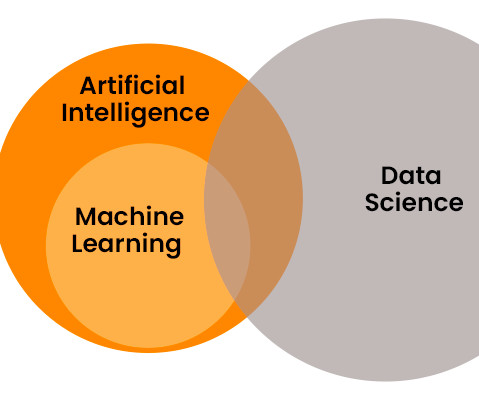
Summary: In the tech landscape of 2024, the distinctions between DataScience and Machine Learning are pivotal. DataScience extracts insights, while Machine Learning focuses on self-learning algorithms. The collective strength of both forms the groundwork for AI and DataScience, propelling innovation.
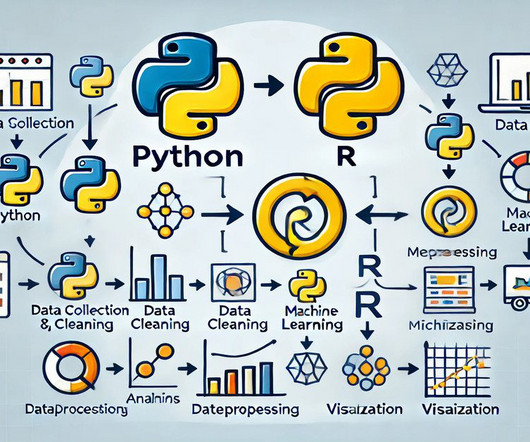
Summary : Combining Python and R enriches DataScience workflows by leveraging Python’s Machine Learning and data handling capabilities alongside R’s statistical analysis and visualisation strengths. Python’s key libraries make data manipulation and Machine Learning workflows seamless. million by 2030.
With technological developments occurring rapidly within the world, Computer Science and DataScience are increasingly becoming the most demanding career choices. Moreover, with the oozing opportunities in DataScience job roles, transitioning your career from Computer Science to DataScience can be quite interesting.
What is R in DataScience? As a programming language it provides objects, operators and functions allowing you to explore, model and visualise data. How is R Used in DataScience? R is a popular programming language and environment widely used in the field of datascience.
So, if you are eyeing your career in the data domain, this blog will take you through some of the best colleges for DataScience in India. There is a growing demand for employees with digital skills The world is drifting towards data-based decision making In India, a technology analyst can make between ₹ 5.5
DataScientists are highly in demand across different industries for making use of the large volumes of data for analysisng and interpretation and enabling effective decision making. One of the most effective programming languages used by DataScientists is R, that helps them to conduct dataanalysis and make future predictions.
Researchers, statisticians, and data analysts rely on histograms to gain insights into data distributions, identify patterns, and detect outliers. Datascientists and machine learning practitioners use histograms as part of exploratorydataanalysis and feature engineering.
DataScience interviews are pivotal moments in the career trajectory of any aspiring datascientist. Having the knowledge about the datascience interview questions will help you crack the interview. DataScience skills that will help you excel professionally.
As a datascientist, we will explore the entire data set to understand each characteristic and identify any patterns existing if any in it. This process is called ExploratoryDataAnalysis(EDA). Step III: Data organization and Feature Engineering This is a crucial step to get accurate results.
Discover the power of Python libraries for (partial) automation of ExploratoryDataAnalysis (EDA). These tools empower both seasoned DataScientists and beginners to explore datasets efficiently, extracting meaningful insights without the usual time constraints. What are auto EDA libraires?
Summary : This article equips Data Analysts with a solid foundation of key DataScience terms, from A to Z. Introduction In the rapidly evolving field of DataScience, understanding key terminology is crucial for Data Analysts to communicate effectively, collaborate effectively, and drive data-driven projects.
We organize all of the trending information in your field so you don't have to. Join 17,000+ users and stay up to date on the latest articles your peers are reading.
You know about us, now we want to get to know you!
Let's personalize your content
Let's get even more personalized
We recognize your account from another site in our network, please click 'Send Email' below to continue with verifying your account and setting a password.


Let's personalize your content