This site uses cookies to improve your experience. To help us insure we adhere to various privacy regulations, please select your country/region of residence. If you do not select a country, we will assume you are from the United States. Select your Cookie Settings or view our Privacy Policy and Terms of Use.
Cookie Settings
Cookies and similar technologies are used on this website for proper function of the website, for tracking performance analytics and for marketing purposes. We and some of our third-party providers may use cookie data for various purposes. Please review the cookie settings below and choose your preference.
Used for the proper function of the website
Used for monitoring website traffic and interactions
Cookie Settings
Cookies and similar technologies are used on this website for proper function of the website, for tracking performance analytics and for marketing purposes. We and some of our third-party providers may use cookie data for various purposes. Please review the cookie settings below and choose your preference.
Strictly Necessary: Used for the proper function of the website
Performance/Analytics: Used for monitoring website traffic and interactions
Plots in datascience play a pivotal role in unraveling complex insights from data. Learn about 33 tools to visualizedata with this blog In this blog post, we will delve into some of the most important plots and concepts that are indispensable for any data scientist.
“Statistics is the grammar of science”, Karl Pearson In the world of datascience, there is a secret language that benefits those who understand it. Do you want to know what makes a data expert efficient? It’s having a profound understanding of the data. This is where inferential statistics comes in handy.
In the modern digital era, this particular area has evolved to give rise to a discipline known as DataScience. DataScience offers a comprehensive and systematic approach to extracting actionable insights from complex and unstructured data.
Datascience bootcamps are intensive short-term educational programs designed to equip individuals with the skills needed to enter or advance in the field of datascience. They cover a wide range of topics, ranging from Python, R, and statistics to machine learning and datavisualization.
“The greatest value of a picture is when it forces us to notice what we never expected to see.” John Tukey, American Mathematician A core skill to possess for someone who aims to pursue datascience, data analysis or affiliated fields as a career is exploratory data analysis (EDA).
Skills for data analysts 2023 10 essential skills for data analysts to have in 2023 Here are 10 essential skills for data analysts to have in 2023: 1. DataVisualization: Topping the list of skills for data analysts datavisualization stands first.
Machine learning engineer vs data scientist: two distinct roles with overlapping expertise, each essential in unlocking the power of data-driven insights. As businesses strive to stay competitive and make data-driven decisions, the roles of machine learning engineers and data scientists have gained prominence.
Whether you’re an aspiring professional or looking to transition into this dynamic field, understanding the essential skills required can pave the way for a successful career in DataScience. To embark on a successful journey in the realm of DataScience, mastering key skills is imperative.
What is R in DataScience? As a programming language it provides objects, operators and functions allowing you to explore, model and visualise data. How is R Used in DataScience? R is a popular programming language and environment widely used in the field of datascience.
Summary: Confused about DataScience course requirements? Learn how to assess courses and prepare for enrollment to launch your DataScience journey. The world runs on data. From targeted advertising to personalized healthcare, DataScience is revolutionizing every industry. Let’s Get Started !!!
Proficient in programming languages like Python or R, data manipulation libraries like Pandas, and machine learning frameworks like TensorFlow and Scikit-learn, data scientists uncover patterns and trends through statistical analysis and datavisualization. DataVisualization: Matplotlib, Seaborn, Tableau, etc.
Summary: The DataScience and Data Analysis life cycles are systematic processes crucial for uncovering insights from raw data. Quality data is foundational for accurate analysis, ensuring businesses stay competitive in the digital landscape. Understanding their life cycles is critical to unlocking their potential.
Hey guys, in this blog we will see some of the most asked DataScience Interview Questions by interviewers in [year]. Datascience has become an integral part of many industries, and as a result, the demand for skilled data scientists is soaring. What is DataScience?
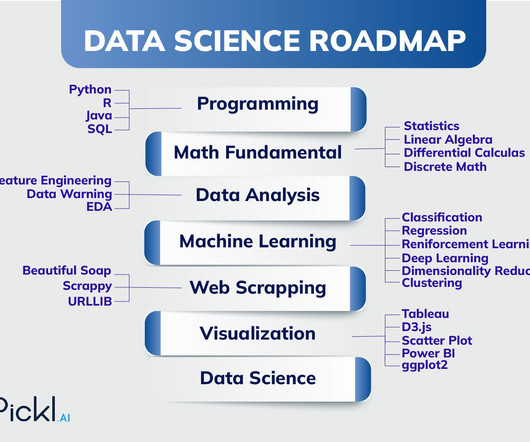
This guide throws light on the roadmap to becoming a Data Scientist. Key Takeaways: DataScience is a multidisciplinary field bridging statistics, mathematics, and computer science to extract insights from data.
This involves cleaning and transforming the data into a format that can be analyzed. Some common data preparation tasks include removing missing values, checking for outliers, and normalizing the data. Step 2: DataVisualization The next step is to visualize the data using graphs and charts.
With more than 650% growth since 2012, DataScience has emerged as one of the most sought-after technologies. With the new developments in this domain, DataScience presents a picture of futuristic technology. A Data Scientist’s average salary in India is up to₹ 8.0 Data Scientist Salary in Hyderabad : ₹ 8.0
Causation establishes direct cause-effect relationships in Data Analysis. Relevance of Statistics in DataScience Statistics plays a crucial role in DataScience and Data Analysis , serving as the backbone for extracting meaningful insights from complex datasets.
Machine learning engineers are professionals who possess a blend of skills in software engineering and datascience. Their primary role is to leverage their programming and coding abilities to gather, process, and analyze large volumes of data. Does a machine learning engineer do coding? percentage points.
Clean and preprocess data to ensure its quality and reliability. Statistical Analysis: Apply statistical techniques to analyse data, including descriptive statistics, hypothesistesting, regression analysis, and machine learning algorithms. Analyse experimental results and draw conclusions based on statistical analysis.
Prediction Configuration for Base Level for Statisical Learning Models Visualization of Probability Distribution for HypothesisTestsTest Mode for Cox Regression and Surivival Forest But, the most important one is the new Prediction capability. Analytics We have made several enhancements in Analytics. Exploratory v6.3
The career of a Data Analyst is highly lucrative today and with the right skills, your dream job is just around the corner. It is expected that the DataScience market will have more than 11 million job roles in India by 2030, opening up opportunities for you. Visual Appeal: Use clean and visually appealing DataVisualizations.
Data Analysis Data analysis is the heart of deriving insights from the gathered information. DataVisualizationDatavisualization transforms complex data sets into intuitive and visually appealing representations. Graphs, charts, and infographics aid in conveying information effectively.
Students should learn about data wrangling and the importance of data quality. Statistical Analysis Introducing statistical methods and techniques for analysing data, including hypothesistesting, regression analysis, and descriptive statistics.
This comprehensive blog outlines vital aspects of Data Analyst interviews, offering insights into technical, behavioural, and industry-specific questions. It covers essential topics such as SQL queries, datavisualization, statistical analysis, machine learning concepts, and data manipulation techniques.
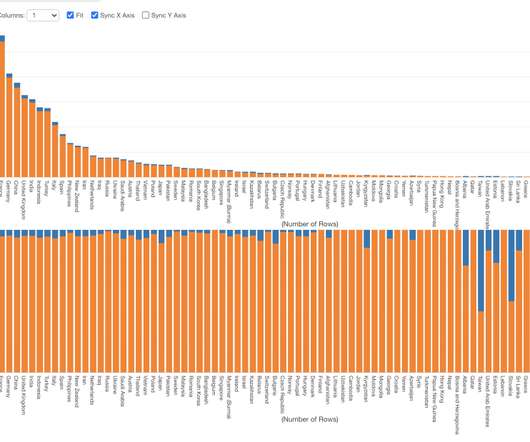
Steps to Perform DataVisualization: Datavisualization is the presentation of information and statistics using visual tools that include charts, graphs, and maps. Its goal is to create patterns in data, trends, and anomalies comprehensible to both data professionals and people without technical knowledge.
We organize all of the trending information in your field so you don't have to. Join 17,000+ users and stay up to date on the latest articles your peers are reading.
You know about us, now we want to get to know you!
Let's personalize your content
Let's get even more personalized
We recognize your account from another site in our network, please click 'Send Email' below to continue with verifying your account and setting a password.


Let's personalize your content