This site uses cookies to improve your experience. To help us insure we adhere to various privacy regulations, please select your country/region of residence. If you do not select a country, we will assume you are from the United States. Select your Cookie Settings or view our Privacy Policy and Terms of Use.
Cookie Settings
Cookies and similar technologies are used on this website for proper function of the website, for tracking performance analytics and for marketing purposes. We and some of our third-party providers may use cookie data for various purposes. Please review the cookie settings below and choose your preference.
Used for the proper function of the website
Used for monitoring website traffic and interactions
Cookie Settings
Cookies and similar technologies are used on this website for proper function of the website, for tracking performance analytics and for marketing purposes. We and some of our third-party providers may use cookie data for various purposes. Please review the cookie settings below and choose your preference.
Strictly Necessary: Used for the proper function of the website
Performance/Analytics: Used for monitoring website traffic and interactions
This article was published as a part of the DataScience Blogathon Overview Tableau is a well-known datavisualization tool widely used in the industry and adopted by major firms like Nike, Coca-Cola, Skype, TCS, Accenture, and various other plethoras of companies both large and small.
Introduction Tableau is a powerful datavisualization tool that is crucial in DataScience. Its significance lies in its ability to transform complex data into easily understandable visualizations, aiding in better decision-making processes.
This article was published as a part of the DataScience Blogathon. There has been a debate in the industry between R and Tableau. Source – Author What is DataVisualization? Datavisualization is an interdisciplinary field that uses visual elements […].
Remote work quickly transitioned from a perk to a necessity, and datascience—already digital at heart—was poised for this change. For data scientists, this shift has opened up a global market of remote datascience jobs, with top employers now prioritizing skills that allow remote professionals to thrive.
This article was published as a part of the DataScience Blogathon This article covers all the basic to intermediate concepts and features of Tableau from scratch. This is the perfect article for you if you are an absolute beginner in Tableau.
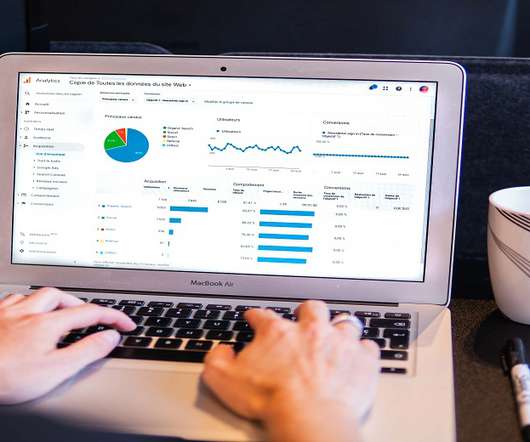
Introduction Tableau is a powerful datavisualization tool that allows users to analyze and present data interactively and meaningfully. It helps businesses make data-driven decisions by providing easy-to-understand insights and visualizations.
This article was published as a part of the DataScience Blogathon. Introduction With this Tableau tutorial, you’ll learn how to visualizedata and derive valuable insights from raw data, making dashboards, reports, tables, and more. Tableau is a […].
This article was published as a part of the DataScience Blogathon. Introduction to Tableau Tips! Creating a chart or visual in Tableau is. The post 5 Tableau Tips for Designing a Tidy and Impactful Visualization appeared first on Analytics Vidhya.
This article was published as a part of the DataScience Blogathon. The post Integrate R, Tableau and Excel appeared first on Analytics Vidhya. Introduction There have been many articles online showing how to connect R.
This article was published as a part of the DataScience Blogathon. Introduction Tableau is a datavisualization tool created in Salesforce that allows users to connect to any database, like SQL or MongoDB, and interact freely.
Introduction While Tableau remains a popular choice for datavisualization, its dominance is waning. The increasing importance of data analysis across industries has fueled the demand for versatile tools, leading to a surge in Tableau alternatives.
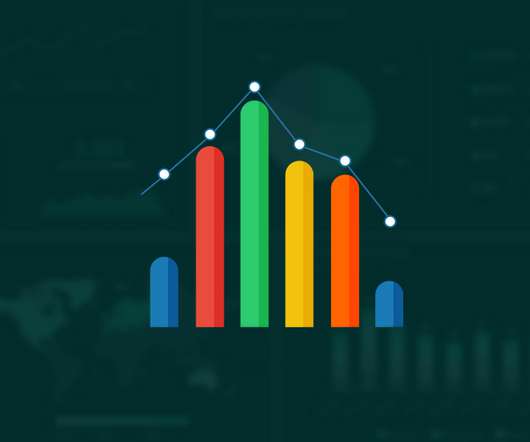
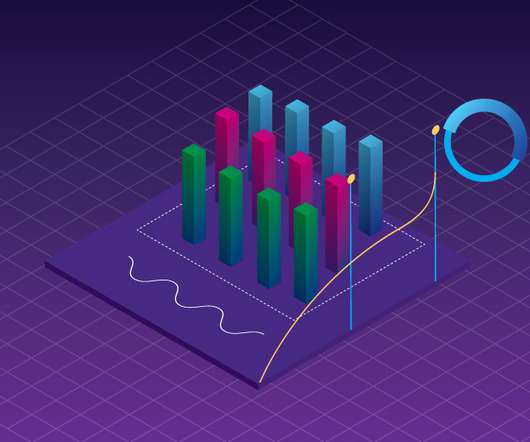
Datavisualization is the art of presenting complex information in a way that is easy to understand and analyze. With the explosion of data in today’s business world, the ability to create compelling datavisualizations has become a critical skill for anyone working with data.
ArticleVideo Book This article was published as a part of the DataScience Blogathon. Introduction Tableau is a powerful DataVisualization software, and much. The post Building a Covid-19 Vaccination Dashboard in Tableau appeared first on Analytics Vidhya.
In essence, data scientists use their skills to turn raw data into valuable information that can be used to improve products, services, and business strategies. Key concepts to master datascienceDatascience is driving innovation across different sectors.
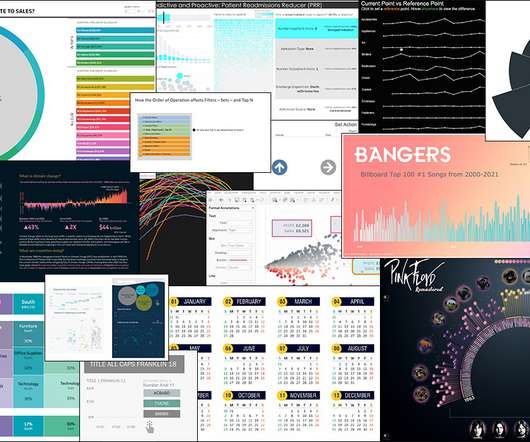
ArticleVideo Book This article was published as a part of the DataScience Blogathon. Introduction Datavisualization is the practice of translating data into. The post Top 10 DataVisualization Tools appeared first on Analytics Vidhya.
This article was published as a part of the DataScience Blogathon. Introduction on Tableau Hi and welcome to this article. Visualization has become a necessary skill that eases the process of communicating with people outside your domain.
ArticleVideo Book This article was published as a part of the DataScience Blogathon. Introduction DataVisualization is a graphical way to represent data by. The post Make Your TableauVisuals More Effective – Tips And Tricks appeared first on Analytics Vidhya.
The post A Comprehensive Step-by-Step Guide to Become an Industry Ready DataScience Professional appeared first on Analytics Vidhya. ArticleVideo Book Introduction to Artificial Intelligence and Machine Learning Artificial Intelligence (AI) and its sub-field Machine Learning (ML) have taken the world by storm.
Companies use Business Intelligence (BI), DataScience , and Process Mining to leverage data for better decision-making, improve operational efficiency, and gain a competitive edge. The integration of these technologies helps companies harness data for growth and efficiency. Each applications has its own data model.
Blog Top Posts About Topics AI Career Advice Computer Vision Data Engineering DataScience Language Models Machine Learning MLOps NLP Programming Python SQL Datasets Events Resources Cheat Sheets Recommendations Tech Briefs Advertise Join Newsletter AI Agents in Analytics Workflows: Too Early or Already Behind? value_counts().head(15)
In essence, data scientists use their skills to turn raw data into valuable information that can be used to improve products, services, and business strategies. Key concepts to master datascience The Importance of Statistics Statistics is the foundation of datascience.
ArticleVideo Book This article was published as a part of the DataScience Blogathon. Can you tell a story using data? The post From Scratch to a Story – Introduction to Tableau (Part 1) appeared first on Analytics Vidhya. Let us look.
The post A Comprehensive Step-by-Step Guide to Become an Industry-Ready DataScience Professional appeared first on Analytics Vidhya. Introduction to Artificial Intelligence and Machine Learning Artificial Intelligence (AI) and its sub-field Machine Learning (ML) have taken the world by storm.
Datascience bootcamps are intensive short-term educational programs designed to equip individuals with the skills needed to enter or advance in the field of datascience. They cover a wide range of topics, ranging from Python, R, and statistics to machine learning and datavisualization.
Datavisualization is the perfect solution to get over the headache. Datavisualization is the art and science of representing data in a visual format, such as charts, graphs, maps, and infographics. We all have faced problems when we interacted with large databases and numbers in tabular format.
The field of datascience is now one of the most preferred and lucrative career options available in the area of data because of the increasing dependence on data for decision-making in businesses, which makes the demand for datascience hires peak.
ArticleVideo Book This article was published as a part of the DataScience Blogathon. Introduction Visual analytics can tell the users the story of data. The post Data Preparation for Analysis : Towards Creating your Tableau Dashboard?—?Part Part 1 appeared first on Analytics Vidhya.
Technical Evangelist Director, Tableau. Welcome to Best of Tableau Web! In just a few days, we’ll all be watching—and I’ll be co-hosting for the fourth time— Iron Viz , the ultimate visualization showdown, at #Data21. Klassen and Tudorancea/Tableau Public]. Calculating the Difference Between Any Two Points in Tableau.
Ateken Abla March 19, 2024 - 9:05pm Larissa Amoroso Vice President, Tableau Community, Tableau When Karolina Grodzinska took the stage at Tableau Conference as part of her Iron Viz: Student Edition award, it felt like the culmination of her data learning, which started in 2021. How did Karolina discover Tableau? “It
Summary: Business Analytics focuses on interpreting historical data for strategic decisions, while DataScience emphasizes predictive modeling and AI. Introduction In today’s data-driven world, businesses increasingly rely on analytics and insights to drive decisions and gain a competitive edge.
Summary : Prepare for your datavisualization interview with our guide to the top questions and answers. Introduction Datavisualization is no longer just a niche skill; it’s a fundamental component of Data Analysis , business intelligence, and datascience.
A plethora of datascience and business intelligence professionals and organizations have asked. What’s the best Business Intelligence and Analytics tool in the market? The post Gartner’s 2020 Magic Quadrant is Out! Check out the latest developments in Best Analytics Tools appeared first on Analytics Vidhya.
Tableau celebrated its 14th annual Tableau Conference—and the largest data party of the year drew data rockstars from all over the globe to learn, connect, and be inspired by their peers, experts, and thought leaders. The data opportunity ahead. Closing the gap with the Tableau Economy. Kristin Adderson.
Tableau Academic Programs Instructional Designer. Bridge the data literacy gap for students in academia. Working with data is a necessity for most jobs, and analytical skills can be a huge differentiator for success across all kinds of work—whether corporate, nonprofit, or academic. Learning how to communicate with data .
Product Manager, Tableau. Tableau Public provides a place for the global data community to develop data skills and, in turn, foster Data Culture. More than 2 million authors use the free platform to explore, create, and publicly share datavisualizations—and grow their portfolios. Alex Novelli.
Technical Evangelist Director, Tableau. Welcome to Best of Tableau Web! In just a few days, we’ll all be watching—and I’ll be co-hosting for the fourth time— Iron Viz , the ultimate visualization showdown, at Tableau Conference. Klassen and Tudorancea/Tableau Public]. Tableau how to display 15 minute intervals.
Product Manager, Tableau. Tableau Public provides a place for the global data community to develop data skills and, in turn, foster Data Culture. More than 2 million authors use the free platform to explore, create, and publicly share datavisualizations—and grow their portfolios. Alex Novelli.
Introduction The world is transforming by AI, ML, Blockchain, and DataScience drastically, and hence its community is growing rapidly. So, to provide our community with the knowledge they need to master these domains, Analytics Vidhya has launched its DataHour sessions.
National Solutions Engineer, Tableau . Welcome to the Best of the Tableau Web! Each month we showcase the amazing outputs from the Tableau Community, including blogs, podcasts, and even videos. This month we take things to the next level and recognize community members who have written the book(s) on data! Bronwen Boyd.
National Solutions Engineer, Tableau . Welcome to the Best of the Tableau Web! Each month we showcase the amazing outputs from the Tableau Community, including blogs, podcasts, and even videos. This month we take things to the next level and recognize community members who have written the book(s) on data! Bronwen Boyd.
RapidMiner RapidMiner is a commercial datascience platform that can be used for a variety of data analysis tasks. It is a powerful ai tool that can be used to automate many of the tasks involved in data analysis, and it can also help businesses to discover new insights from their data.
Tableau celebrated its 14th annual Tableau Conference—and the largest data party of the year drew data rockstars from all over the globe to learn, connect, and be inspired by their peers, experts, and thought leaders. The data opportunity ahead. Closing the gap with the Tableau Economy. Kristin Adderson.
Here’s what we found for both skills and platforms that are in demand for data scientist jobs. DataScience Skills and Competencies Aside from knowing particular frameworks and languages, there are various topics and competencies that any data scientist should know. Joking aside, this does infer particular skills.
This article was published as a part of the DataScience Blogathon Introduction After months of research, development, and clinical trials vaccines for Covid-19 were released to the public. Since then vaccination drives are being run by medical associations and governments across the globe. Countries like UK […].
We organize all of the trending information in your field so you don't have to. Join 17,000+ users and stay up to date on the latest articles your peers are reading.
You know about us, now we want to get to know you!
Let's personalize your content
Let's get even more personalized
We recognize your account from another site in our network, please click 'Send Email' below to continue with verifying your account and setting a password.


Let's personalize your content