This site uses cookies to improve your experience. To help us insure we adhere to various privacy regulations, please select your country/region of residence. If you do not select a country, we will assume you are from the United States. Select your Cookie Settings or view our Privacy Policy and Terms of Use.
Cookie Settings
Cookies and similar technologies are used on this website for proper function of the website, for tracking performance analytics and for marketing purposes. We and some of our third-party providers may use cookie data for various purposes. Please review the cookie settings below and choose your preference.
Used for the proper function of the website
Used for monitoring website traffic and interactions
Cookie Settings
Cookies and similar technologies are used on this website for proper function of the website, for tracking performance analytics and for marketing purposes. We and some of our third-party providers may use cookie data for various purposes. Please review the cookie settings below and choose your preference.
Strictly Necessary: Used for the proper function of the website
Performance/Analytics: Used for monitoring website traffic and interactions
Remote work quickly transitioned from a perk to a necessity, and datascience—already digital at heart—was poised for this change. For data scientists, this shift has opened up a global market of remote datascience jobs, with top employers now prioritizing skills that allow remote professionals to thrive.
GPTs for Datascience are the next step towards innovation in various data-related tasks. These are platforms that integrate the field of data analytics with artificial intelligence (AI) and machine learning (ML) solutions. However, our focus lies on exploring the GPTs for datascience available on the platform.
Data is an essential component of any business, and it is the role of a data analyst to make sense of it all. PowerBI is a powerfuldata visualization tool that helps them turn raw data into meaningful insights and actionable decisions.
Continuous Integration and Continuous Delivery (CI/CD) for Data Pipelines: It is a Game-Changer with AnalyticsCreator! The need for efficient and reliable data pipelines is paramount in datascience and data engineering. It offers full BI-Stack Automation, from source to data warehouse through to frontend.
Datascience GPTs are the next step towards innovation in various data-related tasks. OpenAI’s GPT store is designed to make AI-powered solutions more accessible to different community members. However, our focus lies on exploring the datascience GPTs available on the platform.
GPTs for Datascience are the next step towards innovation in various data-related tasks. These are platforms that integrate the field of data analytics with artificial intelligence (AI) and machine learning (ML) solutions. However, our focus lies on exploring the GPTs for datascience available on the platform.
Datascience bootcamps are intensive short-term educational programs designed to equip individuals with the skills needed to enter or advance in the field of datascience. They cover a wide range of topics, ranging from Python, R, and statistics to machine learning and data visualization.
Summary: “DataScience in a Cloud World” highlights how cloud computing transforms DataScience by providing scalable, cost-effective solutions for big data, Machine Learning, and real-time analytics. Advancements in data processing, storage, and analysis technologies power this transformation.
Microsoft Fabric combines multiple elements into a single platform – Image courtesy of Microsoft The contribution of PowerBI The integration of Microsoft PowerBI and Microsoft Fabric offers a powerful combination for organizations seeking comprehensive data analytics and insights.
In March 2023, we had the pleasure of hosting the first edition of the Future of Data and AI conference – an incredible tech extravaganza that drew over 10,000 attendees, featured 30+ industry experts as speakers, and offered 20 engaging panels and tutorials led by the talented team at DataScience Dojo.
In addition to Business Intelligence (BI), Process Mining is no longer a new phenomenon, but almost all larger companies are conducting this data-driven process analysis in their organization. This aspect can be applied well to Process Mining, hand in hand with BI and AI.
The Datamarts capability opens endless possibilities for organizations to achieve their data analytics goals on the PowerBI platform. Before we look into the PowerBI Datamarts, let us take a step back and understand the meaning of a Datamart. in an enterprise data warehouse. What is PowerBI Datamarts?
Though you may encounter the terms “datascience” and “data analytics” being used interchangeably in conversations or online, they refer to two distinctly different concepts. Meanwhile, data analytics is the act of examining datasets to extract value and find answers to specific questions.
Summary : Microsoft Fabric is an end-to-end Data Analytics platform designed for integration, processing, and advanced insights, while PowerBI excels in creating interactive visualisations and reports. Both tools complement each other, enabling seamless data management and visualisation. What is PowerBI?
It is a website that acts like a file database or content management system. The problem may occur when you want to import an Excel file in SharePoint to PowerBI. When you try to get data via the Excel workbook, you have to go to the file location. After that, paste the copied path in the URL in PowerBI.
If you’ve found yourself asking, “How to become a data scientist?” In this detailed guide, we’re going to navigate the exciting realm of datascience, a field that blends statistics, technology, and strategic thinking into a powerhouse of innovation and insights. This is where data visualization comes in.
Open source business intelligence software provides a cost-effective and flexible way for businesses to access and analyze their data. Data visualization: Open source BI software offers a range of visualization options, including charts, graphs, and dashboards, to help businesses understand their data and make informed decisions.
Summary: The future of DataScience is shaped by emerging trends such as advanced AI and Machine Learning, augmented analytics, and automated processes. As industries increasingly rely on data-driven insights, ethical considerations regarding data privacy and bias mitigation will become paramount.
Tableau can help Data Scientists generate graphs, charts, maps and data-driven stories, etc for purpose of visualisation and analysing data. But What is Tableau for DataScience and what are its advantages and disadvantages? How Professionals Can Use Tableau for DataScience? Additionally.
For budding data scientists and data analysts, there are mountains of information about why you should learn R over Python and the other way around. Though both are great to learn, what gets left out of the conversation is a simple yet powerful programming language that everyone in the datascience world can agree on, SQL.
The roles of data scientists and data analysts cannot be over-emphasized as they are needed to support decision-making. This article will serve as an ultimate guide to choosing between DataScience and Data Analytics. Before going into the main purpose of this article, what is data?
The following steps are involved in pipeline development: Gathering data: The first step is to gather the data that will be used to train the model. For data scrapping a variety of sources, such as online databases, sensor data, or social media. This involves removing any errors or inconsistencies in the data.
Summary This blog post demystifies datascience for business leaders. It explains key concepts, explores applications for business growth, and outlines steps to prepare your organization for data-driven success. DataScience Cheat Sheet for Business Leaders In today’s data-driven world, information is power.
Summary: The difference between DataScience and Data Analytics lies in their approachData Science uses AI and Machine Learning for predictions, while Data Analytics focuses on analysing past trends. DataScience requires advanced coding, whereas Data Analytics relies on statistical methods.
We all have faced problems when we interacted with large databases and numbers in tabular format. Data visualization is the perfect solution to get over the headache. Data visualization is the art and science of representing data in a visual format, such as charts, graphs, maps, and infographics.
Data engineers are essential professionals responsible for designing, constructing, and maintaining an organization’s data infrastructure. They create data pipelines, ETL processes, and databases to facilitate smooth data flow and storage.
There is a plethora of BI tools available in the market today, with new ones being added yearly. Through a comparative analysis of some of the leading BI tools: Google Looker, Microsoft PowerBI, Tableau and Qlik Sense, discover which BI solution best fits your organization’s data analytics needs to empower informed decision-making.
It leverages the power of technology to provide actionable insights and recommendations that support effective decision-making in complex business scenarios. At its core, decision intelligence involves collecting and integrating relevant data from various sources, such as databases, text documents, and APIs.
These tools offer a wide range of functionalities to handle complex data preparation tasks efficiently. The tool also employs AI capabilities for automatically providing attribute names and short descriptions for reports, making it easy to use and efficient for data preparation.
As the sibling of datascience, data analytics is still a hot field that garners significant interest. Companies have plenty of data at their disposal and are looking for people who can make sense of it and make deductions quickly and efficiently. As you see, there are a number of reporting platforms as expected.
Data timeliness: Data timeliness refers to the extent to which the data is up-to-date and available when needed. Outdated or delayed data can result in missed opportunities or incorrect decisions. Cracking the code: How database encryption keeps your data safe? Examples include Tableau and PowerBI.
By 2020, over 40 percent of all datascience tasks will be automated. It’s for good reason too because automation and powerful machine learning tools can help extract insights that would otherwise be difficult to find even by skilled analysts. Data processing is another skill vital to staying relevant in the analytics field.
Database Administrator (DBA): They are responsible for managing and maintaining databases used by organizations to store and retrieve data. They ensure data security, optimize database performance, and troubleshoot any issues that arise. Why Pursue a Course in DataScience?
As you can imagine, datascience is a pretty loose term or big tent idea overall. Though just about every industry imaginable utilizes the skills of a data-focused professional, each has its own challenges, needs, and desired outcomes. What makes this job title unique is the “Swiss army knife” approach to data.
Whether you’re a beginner or a seasoned pro, you’ll find valuable insights on core concepts like normalization, transactions, and database joins. Top DBMS Interview Questions and Answers (2024 Edition) The world runs on data, and at the heart of data management lies the Database Management System (DBMS).
Data timeliness: Data timeliness refers to the extent to which the data is up-to-date and available when needed. Outdated or delayed data can result in missed opportunities or incorrect decisions. Cracking the code: How database encryption keeps your data safe? Examples include Tableau and PowerBI.
Summary: Descriptive Analytics tools transform historical data into visual reports, helping businesses identify trends and improve decision-making. Popular tools like PowerBI, Tableau, and Google Data Studio offer unique features for Data Analysis.
Summary: This blog provides a comprehensive roadmap for aspiring Azure Data Scientists, outlining the essential skills, certifications, and steps to build a successful career in DataScience using Microsoft Azure. Integration: Seamlessly integrates with popular DataScience tools and frameworks, such as TensorFlow and PyTorch.
Data Blending is a technique used in data analysis to combine information from multiple datasets into a single unified view. It allows analysts to integrate data from disparate sources, such as different databases or files, and explore relationships between them. What is Data Blending in PowerBI?
We are living in a world where data drives decisions. Data manipulation in DataScience is the fundamental process in data analysis. The data professionals deploy different techniques and operations to derive valuable information from the raw and unstructured data. What is Data Manipulation?
This newfound proficiency not only empowers them to become true data storytellers but also elevates their value within their organizations, placing them at the forefront of data-driven success. Here it is important to mention that Tableau for DataScience is eaully significant. This course prepares you for the future.
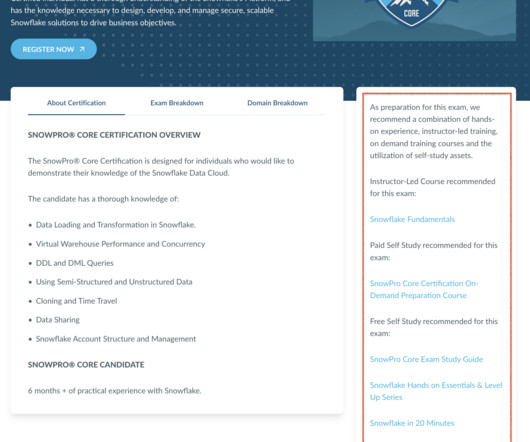
Snowflake’s SnowPro Advanced Certifications assess advanced Snowflake knowledge and skills relating to five datascience roles. The SnowPro Advanced Architect Certification consists of a target audience that includes Solution Architects, Database Architects, and System Architects.
This massive influx of data necessitates robust storage solutions and processing capabilities. Variety Variety indicates the different types of data being generated. This includes structured data (like databases), semi-structured data (like XML files), and unstructured data (like text documents and videos).
Some of the key tools used for sequence analysis include: BLAST (Basic Local Alignment Search Tool) BLAST compares a query sequence with a database of known sequences to identify similar regions. It is useful for visualising complex data and identifying patterns and trends. What are Some of the Key Applications of Bioinformatics?
We organize all of the trending information in your field so you don't have to. Join 17,000+ users and stay up to date on the latest articles your peers are reading.
You know about us, now we want to get to know you!
Let's personalize your content
Let's get even more personalized
We recognize your account from another site in our network, please click 'Send Email' below to continue with verifying your account and setting a password.


Let's personalize your content