This site uses cookies to improve your experience. To help us insure we adhere to various privacy regulations, please select your country/region of residence. If you do not select a country, we will assume you are from the United States. Select your Cookie Settings or view our Privacy Policy and Terms of Use.
Cookie Settings
Cookies and similar technologies are used on this website for proper function of the website, for tracking performance analytics and for marketing purposes. We and some of our third-party providers may use cookie data for various purposes. Please review the cookie settings below and choose your preference.
Used for the proper function of the website
Used for monitoring website traffic and interactions
Cookie Settings
Cookies and similar technologies are used on this website for proper function of the website, for tracking performance analytics and for marketing purposes. We and some of our third-party providers may use cookie data for various purposes. Please review the cookie settings below and choose your preference.
Strictly Necessary: Used for the proper function of the website
Performance/Analytics: Used for monitoring website traffic and interactions
Plots in datascience play a pivotal role in unraveling complex insights from data. Learn about 33 tools to visualize data with this blog In this blog post, we will delve into some of the most important plots and concepts that are indispensable for any data scientist. Want to get started with datascience?
In the modern digital era, this particular area has evolved to give rise to a discipline known as DataScience. DataScience offers a comprehensive and systematic approach to extracting actionable insights from complex and unstructured data.
In contemporary times, datascience has emerged as a substantial and progressively expanding domain that has an impact on virtually every sphere of human ingenuity: be it commerce, technology, healthcare, education, governance, and beyond. This piece will concentrate on the elemental constituents constituting datascience.
Summary: DataScience and AI are transforming the future by enabling smarter decision-making, automating processes, and uncovering valuable insights from vast datasets. Bureau of Labor Statistics predicts that employment for Data Scientists will grow by 36% from 2021 to 2031 , making it one of the fastest-growing professions.
DataScience interviews are pivotal moments in the career trajectory of any aspiring data scientist. Having the knowledge about the datascience interview questions will help you crack the interview. DataScience skills that will help you excel professionally.
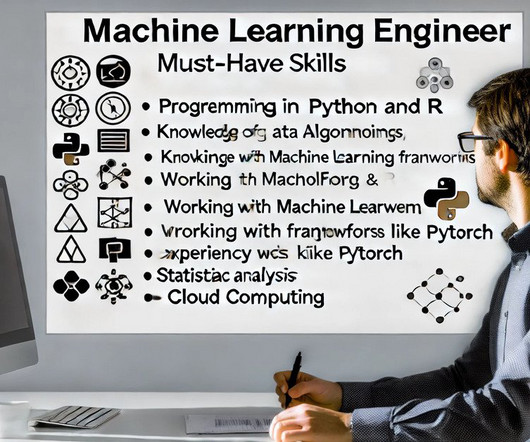
Whether you’re an aspiring professional or looking to transition into this dynamic field, understanding the essential skills required can pave the way for a successful career in DataScience. To embark on a successful journey in the realm of DataScience, mastering key skills is imperative.
Summary : This article equips Data Analysts with a solid foundation of key DataScience terms, from A to Z. Introduction In the rapidly evolving field of DataScience, understanding key terminology is crucial for Data Analysts to communicate effectively, collaborate effectively, and drive data-driven projects.
Summary: The DataScience and Data Analysis life cycles are systematic processes crucial for uncovering insights from raw data. From acquisition to interpretation, these cycles guide decision-making, drive innovation, and enhance operational efficiency. billion INR by 2026, with a CAGR of 27.7%.
What is R in DataScience? As a programming language it provides objects, operators and functions allowing you to explore, model and visualise data. How is R Used in DataScience? R is a popular programming language and environment widely used in the field of datascience.
With the expanding field of DataScience, the need for efficient and skilled professionals is increasing. Its efficacy may allow kids from a young age to learn Python and explore the field of DataScience. Its efficacy may allow kids from a young age to learn Python and explore the field of DataScience.
Summary: The blog explores the synergy between Artificial Intelligence (AI) and DataScience, highlighting their complementary roles in Data Analysis and intelligent decision-making. This article explores how AI and DataScience complement each other, highlighting their combined impact and potential.
Hey guys, in this blog we will see some of the most asked DataScience Interview Questions by interviewers in [year]. Datascience has become an integral part of many industries, and as a result, the demand for skilled data scientists is soaring. What is DataScience?
With more than 650% growth since 2012, DataScience has emerged as one of the most sought-after technologies. With the new developments in this domain, DataScience presents a picture of futuristic technology. A Data Scientist’s average salary in India is up to₹ 8.0 Data Scientist Salary in Hyderabad : ₹ 8.0
Key Objectives of Statistical Modeling Prediction : One of the primary goals of Statistical Modeling is to predict future outcomes based on historical data. This is especially useful in finance and weather forecasting, where predictions guide decision-making. They are essential in scientific research for concluding limited data.
Concepts such as probability distributions, hypothesistesting , and Bayesian inference enable ML engineers to interpret results, quantify uncertainty, and improve model predictions. DecisionTrees These trees split data into branches based on feature values, providing clear decision rules.
Drill-Down Capabilities: The ability to explore data at granular levels to identify contributing factors. HypothesisTesting : Employing statistical tests to validate hypotheses about causal relationships. Data Cleansing: Ensuring data quality and removing outliers to improve model accuracy. Key Features: i.
Students should learn about data wrangling and the importance of data quality. Statistical Analysis Introducing statistical methods and techniques for analysing data, including hypothesistesting, regression analysis, and descriptive statistics.
What are the advantages and disadvantages of decisiontrees ? Advantages: It is easy to interpret and visualise, can handle numerical and categorical data, and requires fewer data preprocessing. I would perform exploratory data analysis to identify patterns and trends related to customer behaviour.
In statistics: – Utilized for hypothesistesting to assess the validity of statistical models. In machine learning: – Improves decisiontree algorithms, particularly in the node-splitting phase, adding precision to predictions.
We organize all of the trending information in your field so you don't have to. Join 17,000+ users and stay up to date on the latest articles your peers are reading.
You know about us, now we want to get to know you!
Let's personalize your content
Let's get even more personalized
We recognize your account from another site in our network, please click 'Send Email' below to continue with verifying your account and setting a password.


Let's personalize your content