This site uses cookies to improve your experience. To help us insure we adhere to various privacy regulations, please select your country/region of residence. If you do not select a country, we will assume you are from the United States. Select your Cookie Settings or view our Privacy Policy and Terms of Use.
Cookie Settings
Cookies and similar technologies are used on this website for proper function of the website, for tracking performance analytics and for marketing purposes. We and some of our third-party providers may use cookie data for various purposes. Please review the cookie settings below and choose your preference.
Used for the proper function of the website
Used for monitoring website traffic and interactions
Cookie Settings
Cookies and similar technologies are used on this website for proper function of the website, for tracking performance analytics and for marketing purposes. We and some of our third-party providers may use cookie data for various purposes. Please review the cookie settings below and choose your preference.
Strictly Necessary: Used for the proper function of the website
Performance/Analytics: Used for monitoring website traffic and interactions
Remote work quickly transitioned from a perk to a necessity, and datascience—already digital at heart—was poised for this change. For data scientists, this shift has opened up a global market of remote datascience jobs, with top employers now prioritizing skills that allow remote professionals to thrive.
This guide walks you through the steps that will allow you to create easily updatable, automated and scalable PowerBI / Tableau dashboards. Although dashboards have become quite an integral part of performance tracking in organizations, implementing them can be tricky even for the most experienced analysts.
Or regularly build dashboards and visualizations in Tableau or PowerBI? The post Infographic: 11 Steps to Transition into DataScience (for Reporting / MIS / BI Professionals) appeared first on Analytics Vidhya. Introduction Do you often work with reports in Excel? If you answered yes.
Primary Supervised Learning Algorithms Used in Machine Learning; Top 15 Books to Master Data Strategy; Top DataScience Podcasts for 2022; Prepare Your Data for Effective Tableau & PowerBI Dashboards; Generate Synthetic Time-series Data with Open-source Tools.
Introduction Introducing Rishabh Dhingra, a dynamic professional making significant strides in Analytics and DataScience within the prestigious realm of Google. Through his innovative mindset […] The post Journeying Through Google’s Analytics and DataScience Domain appeared first on Analytics Vidhya.
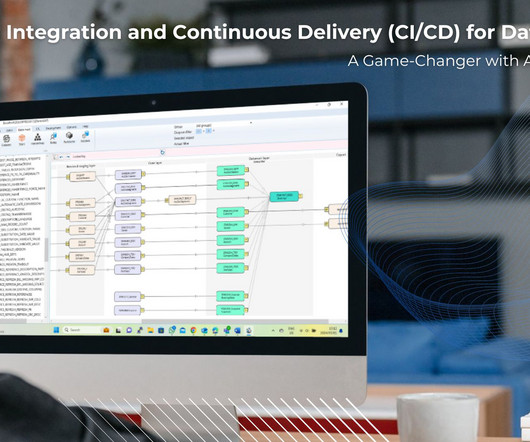
Continuous Integration and Continuous Delivery (CI/CD) for Data Pipelines: It is a Game-Changer with AnalyticsCreator! The need for efficient and reliable data pipelines is paramount in datascience and data engineering. Data Lakes : It supports MS Azure Blob Storage. pipelines, Azure Data Bricks.
Summary: Business Analytics focuses on interpreting historical data for strategic decisions, while DataScience emphasizes predictive modeling and AI. Introduction In today’s data-driven world, businesses increasingly rely on analytics and insights to drive decisions and gain a competitive edge.
Datascience bootcamps are intensive short-term educational programs designed to equip individuals with the skills needed to enter or advance in the field of datascience. They cover a wide range of topics, ranging from Python, R, and statistics to machine learning and data visualization.
Summary: “DataScience in a Cloud World” highlights how cloud computing transforms DataScience by providing scalable, cost-effective solutions for big data, Machine Learning, and real-time analytics. Advancements in data processing, storage, and analysis technologies power this transformation.
Für DataScience ja sowieso. Vor einen Jahrzehnt war es immer noch recht üblich, sich einfach ein BI Tool zu nehmen, sowas wie QlikView, Tableau oder PowerBI, mittlerweile gibt es ja noch einige mehr, und da direkt die Daten reinzuladen und dann halt loszulegen mit dem Aufbau der Reports. dem ERP, CRM usw.,
TableauTableau is a powerfuldata visualization tool that allows users to connect to a wide range of data sources and create interactive dashboards and visualizations. Tableau is easy to use and provides a range of visualization options that are customizable to suit different needs.
Introduction The world is transforming by AI, ML, Blockchain, and DataScience drastically, and hence its community is growing rapidly. So, to provide our community with the knowledge they need to master these domains, Analytics Vidhya has launched its DataHour sessions.
Die Bedeutung effizienter und zuverlässiger Datenpipelines in den Bereichen DataScience und Data Engineering ist enorm. Data Lakes: Unterstützt MS Azure Blob Storage. Frontends : Kompatibel mit Tools wie PowerBI, Qlik Sense und Tableau.
Tableau is a data visualisation software helping you to generate graphics-rich reporting and analysing enormous volumes of data. With the help of Tableau, organisations have been able to mine and gather actionable insights from granular sources of data. Let’s read the blog to find out!
Though you may encounter the terms “datascience” and “data analytics” being used interchangeably in conversations or online, they refer to two distinctly different concepts. Meanwhile, data analytics is the act of examining datasets to extract value and find answers to specific questions.
In addition to Business Intelligence (BI), Process Mining is no longer a new phenomenon, but almost all larger companies are conducting this data-driven process analysis in their organization. For analysis the way of Business Intelligence this normalized data model can already be used.
This module enables businesses to leverage sophisticated data analysis tools and techniques to gain meaningful insights into their operations and drive informed decision-making. BIDW: What makes business intelligence and data warehouses inseparable?
If you’ve found yourself asking, “How to become a data scientist?” In this detailed guide, we’re going to navigate the exciting realm of datascience, a field that blends statistics, technology, and strategic thinking into a powerhouse of innovation and insights. This is where data visualization comes in.
Big Data wurde für viele Unternehmen der traditionellen Industrie zur Enttäuschung, zum falschen Versprechen. Datenqualität hingegen, wurde zum wichtigen Faktor jeder Unternehmensbewertung, was Themen wie Reporting, Data Governance und schließlich dann das Data Engineering mehr noch anschob als die DataScience.
print(llm("Suggest 3 bday gifts for a data scientist"))>>> 1. A subscription to a datascience magazine or journal2. A set of datascience books3. A datascience-themed mug or t-shirt As you can see, we initialize an LLM and call it with a query. turbo", temperature=0.01)conversation_history
Summary: Struggling to translate data into clear stories? Tableau can help! This data visualization tool empowers Data Analysts with drag-and-drop simplicity, interactive dashboards, and a wide range of visualizations. What are The Benefits of Learning Tableau for Data Analysts?
Summary: Data Blending in Tableau is helpful in deriving multiple sources to gain comprehensive insights. Through intuitive drag-and-drop functionality, Tableau enables users to blend disparate datasets effortlessly, facilitating holistic data exploration. What is Data Blending in tableau with an example?
Final verdict Data visualization practices when implemented correctly help you to manage huge amounts of data and represent it in graphs and charts. Designers can get help from some of the best visual tools like Tableau, PowerBI, and more for performing data visualization with ease.
Combining large-scale Earth observation data with other data types enabled many participants to better understand specific issues or locales. For example, honorable mention winner DataScience Nigeria combined satellite imagery with reports of violent incidents from ACLED to better identify areas at high risk of hunger.
Summary: This guide highlights the best free DataScience courses in 2024, offering a practical starting point for learners eager to build foundational DataScience skills without financial barriers. Introduction DataScience skills are in high demand. billion in 2021 and projected to reach $322.9
The roles of data scientists and data analysts cannot be over-emphasized as they are needed to support decision-making. This article will serve as an ultimate guide to choosing between DataScience and Data Analytics. Before going into the main purpose of this article, what is data?
Being part of DataScience, the implementation of these technologies requires expert guidance and monitoring. As a result, Data Scientists are constantly in demand in the market, many are transitioning their careers in the same field. Best DataScience Course with Placement Guarantee 1.
Summary: The difference between DataScience and Data Analytics lies in their approachData Science uses AI and Machine Learning for predictions, while Data Analytics focuses on analysing past trends. DataScience requires advanced coding, whereas Data Analytics relies on statistical methods.
Summary: The healthcare industry is undergoing a data-driven revolution. DataScience is analyzing vast amounts of patient information to predict diseases before they strike, personalize treatment plans based on individual needs, and streamline healthcare operations. quintillion bytes of data each year [source: IBM].
Tools and Techniques Commonly Used Data Analysts rely on various tools to streamline their work. Software like Microsoft Excel and SQL helps them manipulate and query data efficiently. They use data visualisation tools like Tableau and PowerBI to create compelling reports.
Together, data engineers, data scientists, and machine learning engineers form a cohesive team that drives innovation and success in data analytics and artificial intelligence. Their collective efforts are indispensable for organizations seeking to harness data’s full potential and achieve business growth.
These tools offer a wide range of functionalities to handle complex data preparation tasks efficiently. The tool also employs AI capabilities for automatically providing attribute names and short descriptions for reports, making it easy to use and efficient for data preparation.
Before embarking on a datascience transition, it’s crucial to be aware of these key factors. Before diving into the world of datascience, it is essential to familiarize yourself with certain key aspects. Moreover, tools like PowerBI and Tableau can produce remarkable results.
So let’s take a look at some of the free data visualization tools available, and how they can provide actionable insights that allow for driving informed decision-making and strategic planning while keeping to being user friendly. What sets Tableau apart is its intuitive, user-friendly, drag-and-drop interface.
For budding data scientists and data analysts, there are mountains of information about why you should learn R over Python and the other way around. Though both are great to learn, what gets left out of the conversation is a simple yet powerful programming language that everyone in the datascience world can agree on, SQL.
EVENT — ODSC East 2024 In-Person and Virtual Conference April 23rd to 25th, 2024 Join us for a deep dive into the latest datascience and AI trends, tools, and techniques, from LLMs to data analytics and from machine learning to responsible AI. So get your pass today, and keep yourself ahead of the curve.
Summary: Descriptive Analytics tools transform historical data into visual reports, helping businesses identify trends and improve decision-making. Popular tools like PowerBI, Tableau, and Google Data Studio offer unique features for Data Analysis.
By 2020, over 40 percent of all datascience tasks will be automated. It’s for good reason too because automation and powerful machine learning tools can help extract insights that would otherwise be difficult to find even by skilled analysts. The popular tools, on the other hand, include PowerBI, ETL, IBM Db2, and Teradata.
As the sibling of datascience, data analytics is still a hot field that garners significant interest. Companies have plenty of data at their disposal and are looking for people who can make sense of it and make deductions quickly and efficiently. As you see, there are a number of reporting platforms as expected.
This transforms data from mere information to a catalyst for tangible actions. Leverage Tools for Enhanced Data Analysis Evolve beyond basic tools like Excel by exploring advanced platforms such as PowerBI, Tableau, or even Python for more intricate analyses.
As you can imagine, datascience is a pretty loose term or big tent idea overall. Though just about every industry imaginable utilizes the skills of a data-focused professional, each has its own challenges, needs, and desired outcomes. What makes this job title unique is the “Swiss army knife” approach to data.
With more than 650% growth since 2012, DataScience has emerged as one of the most sought-after technologies. With the new developments in this domain, DataScience presents a picture of futuristic technology. A Data Scientist’s average salary in India is up to₹ 8.0 Data Scientist Salary in Hyderabad : ₹ 8.0
Key Takeaways Operations Analysts optimise efficiency through data-driven decision-making. Expertise in tools like PowerBI, SQL, and Python is crucial. Technical Skills In todays data-centric landscape, proficiency in advanced analytics tools and software is crucial for an Operations Analyst.
They gather, clean, analyze, and visualize data using tools like Excel, SQL, and data visualization software. With the increasing importance of data-driven decision-making, Data Analysts are in high demand across various industries. Why Pursue a Course in DataScience?
We organize all of the trending information in your field so you don't have to. Join 17,000+ users and stay up to date on the latest articles your peers are reading.
You know about us, now we want to get to know you!
Let's personalize your content
Let's get even more personalized
We recognize your account from another site in our network, please click 'Send Email' below to continue with verifying your account and setting a password.


Let's personalize your content