This site uses cookies to improve your experience. To help us insure we adhere to various privacy regulations, please select your country/region of residence. If you do not select a country, we will assume you are from the United States. Select your Cookie Settings or view our Privacy Policy and Terms of Use.
Cookie Settings
Cookies and similar technologies are used on this website for proper function of the website, for tracking performance analytics and for marketing purposes. We and some of our third-party providers may use cookie data for various purposes. Please review the cookie settings below and choose your preference.
Used for the proper function of the website
Used for monitoring website traffic and interactions
Cookie Settings
Cookies and similar technologies are used on this website for proper function of the website, for tracking performance analytics and for marketing purposes. We and some of our third-party providers may use cookie data for various purposes. Please review the cookie settings below and choose your preference.
Strictly Necessary: Used for the proper function of the website
Performance/Analytics: Used for monitoring website traffic and interactions
Introduction The world of datascience has numerous candidates with technical expertise, but only a few excel at problem-solving. Fortunately, with the advent of tools such as Tableau, you get access […] The post Top 10 Tableau Projects for DataScience appeared first on Analytics Vidhya.
Remote work quickly transitioned from a perk to a necessity, and datascience—already digital at heart—was poised for this change. For data scientists, this shift has opened up a global market of remote datascience jobs, with top employers now prioritizing skills that allow remote professionals to thrive.
Introduction Tableau is a powerful data visualization tool that is crucial in DataScience. Its significance lies in its ability to transform complex data into easily understandable visualizations, aiding in better decision-making processes.
This article was published as a part of the DataScience Blogathon. There has been a debate in the industry between R and Tableau. Source – Author What is Data Visualization? Data visualization is an interdisciplinary field that uses visual elements […]. Which is better is the question.
This article was published as a part of the DataScience Blogathon. Introduction With this Tableau tutorial, you’ll learn how to visualize data and derive valuable insights from raw data, making dashboards, reports, tables, and more. Tableau is a […].
ArticleVideo Book This article was published as a part of the DataScience Blogathon. The announcement last week that Tableau’s CEO Adam Selipsky is. The post Is the Tableau Era Coming to an End? appeared first on Analytics Vidhya.
This article was published as a part of the DataScience Blogathon. Introduction to Tableau Tips! Creating a chart or visual in Tableau is. The post 5 Tableau Tips for Designing a Tidy and Impactful Visualization appeared first on Analytics Vidhya.
This article was published as a part of the DataScience Blogathon. The post Integrate R, Tableau and Excel appeared first on Analytics Vidhya. Introduction There have been many articles online showing how to connect R.
This article was published as a part of the DataScience Blogathon Overview Tableau is a well-known data visualization tool widely used in the industry and adopted by major firms like Nike, Coca-Cola, Skype, TCS, Accenture, and various other plethoras of companies both large and small.
To DataScience Enthusiasts, We are happy to bring you another webinar into ‘The DataHour’ series. The webinar is based on building and operationalizing your ML Model using Tableau Business Science.
Introduction Tableau is a powerful data visualization tool that allows users to analyze and present data interactively and meaningfully. It helps businesses make data-driven decisions by providing easy-to-understand insights and visualizations.
This article was published as a part of the DataScience Blogathon. The post Customer Segmentation using RFM Analysis in Tableau appeared first on Analytics Vidhya. geography, psychology, and behavior. The main aim of customer segmentation is to identify different groups of customers so that specific […].
This article was published as a part of the DataScience Blogathon This article covers all the basic to intermediate concepts and features of Tableau from scratch. This is the perfect article for you if you are an absolute beginner in Tableau.
Overview There are a plethora of datascience tools out there – which one should you pick up? The post 22 Widely Used DataScience and Machine Learning Tools in 2020 appeared first on Analytics Vidhya. Here’s a list of over 20.
This article was published as a part of the DataScience Blogathon. Introduction Tableau is a data visualization tool created in Salesforce that allows users to connect to any database, like SQL or MongoDB, and interact freely.
Or regularly build dashboards and visualizations in Tableau or Power BI? The post Infographic: 11 Steps to Transition into DataScience (for Reporting / MIS / BI Professionals) appeared first on Analytics Vidhya. Introduction Do you often work with reports in Excel? If you answered yes.
Introduction While Tableau remains a popular choice for data visualization, its dominance is waning. The increasing importance of data analysis across industries has fueled the demand for versatile tools, leading to a surge in Tableau alternatives.
This article was published as a part of the DataScience Blogathon. Introduction on Tableau Hi and welcome to this article. The post A Step by step on Tableau for Beginner appeared first on Analytics Vidhya.
In essence, data scientists use their skills to turn raw data into valuable information that can be used to improve products, services, and business strategies. Key concepts to master datascienceDatascience is driving innovation across different sectors.
The post A Comprehensive Step-by-Step Guide to Become an Industry Ready DataScience Professional appeared first on Analytics Vidhya. ArticleVideo Book Introduction to Artificial Intelligence and Machine Learning Artificial Intelligence (AI) and its sub-field Machine Learning (ML) have taken the world by storm.
ArticleVideo Book This article was published as a part of the DataScience Blogathon. Introduction Tableau is a powerful Data Visualization software, and much. The post Building a Covid-19 Vaccination Dashboard in Tableau appeared first on Analytics Vidhya.
Introduction Introducing Rishabh Dhingra, a dynamic professional making significant strides in Analytics and DataScience within the prestigious realm of Google. Through his innovative mindset […] The post Journeying Through Google’s Analytics and DataScience Domain appeared first on Analytics Vidhya.
Sponsored Content “Completing the program has provided me with proficiency in essential datascience methodologies and programming languages, including R, Python, SQL, and Tableau. Additionally, the program's flexibility allowed me to select project subjects aligned with my interests, fostering hands-on learning experiences.
This guide walks you through the steps that will allow you to create easily updatable, automated and scalable Power BI / Tableau dashboards. Although dashboards have become quite an integral part of performance tracking in organizations, implementing them can be tricky even for the most experienced analysts.
Companies use Business Intelligence (BI), DataScience , and Process Mining to leverage data for better decision-making, improve operational efficiency, and gain a competitive edge. The integration of these technologies helps companies harness data for growth and efficiency. Each applications has its own data model.
ArticleVideo Book This article was published as a part of the DataScience Blogathon. Can you tell a story using data? The post From Scratch to a Story – Introduction to Tableau (Part 1) appeared first on Analytics Vidhya. Let us look.
ArticleVideo Book This article was published as a part of the DataScience Blogathon. Introduction Data Visualization is a graphical way to represent data by. The post Make Your Tableau Visuals More Effective – Tips And Tricks appeared first on Analytics Vidhya.
In essence, data scientists use their skills to turn raw data into valuable information that can be used to improve products, services, and business strategies. Key concepts to master datascience The Importance of Statistics Statistics is the foundation of datascience.
The post A Comprehensive Step-by-Step Guide to Become an Industry-Ready DataScience Professional appeared first on Analytics Vidhya. Introduction to Artificial Intelligence and Machine Learning Artificial Intelligence (AI) and its sub-field Machine Learning (ML) have taken the world by storm.
Primary Supervised Learning Algorithms Used in Machine Learning; Top 15 Books to Master Data Strategy; Top DataScience Podcasts for 2022; Prepare Your Data for Effective Tableau & Power BI Dashboards; Generate Synthetic Time-series Data with Open-source Tools.
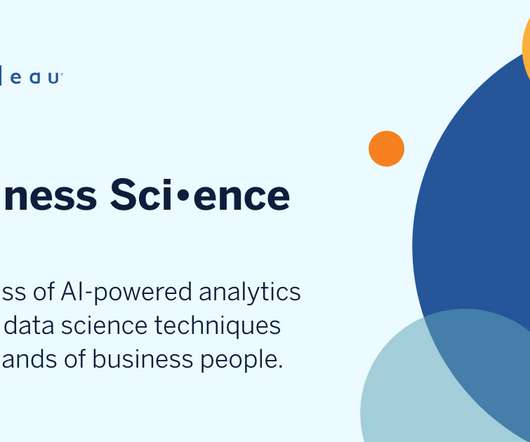
Chief Technology Officer, Tableau. One of the things we’re focused on at Tableau is how to get more people using data in the daily routine of business. We want to reduce those barriers by introducing a new class of analytics: Tableau Business Science. What is Tableau Business Science? Andrew Beers.
ArticleVideo Book This article was published as a part of the DataScience Blogathon. Introduction Visual analytics can tell the users the story of data. The post Data Preparation for Analysis : Towards Creating your Tableau Dashboard?—?Part Part 1 appeared first on Analytics Vidhya.
Datascience bootcamps are intensive short-term educational programs designed to equip individuals with the skills needed to enter or advance in the field of datascience. They cover a wide range of topics, ranging from Python, R, and statistics to machine learning and data visualization.
Product Manager, Tableau. First thing’s first: I am thrilled to announce that Tableau’s analytics extensions are now available in Tableau Online! Starting with R integration in Tableau 8.3, All of these steps have led up to support for integrating Python, R, and other analytics extensions in Tableau Online.
Learn data analytics by taking the best YouTube courses. These courses will cover data analysis with Python, R, SQL, PowerBI, Tableau, Excel, and SPSS.
Summary: “DataScience in a Cloud World” highlights how cloud computing transforms DataScience by providing scalable, cost-effective solutions for big data, Machine Learning, and real-time analytics. Advancements in data processing, storage, and analysis technologies power this transformation.
Summary: Business Analytics focuses on interpreting historical data for strategic decisions, while DataScience emphasizes predictive modeling and AI. Introduction In today’s data-driven world, businesses increasingly rely on analytics and insights to drive decisions and gain a competitive edge.
After all, writing datascience articles is from where it all started. Introduction Our long-time followers know how much writing is at the core of this organization. And with each passing year, we have achieved nothing short of miracles with this intention to teach people with our words. At the end of 2021, we are […].
Technical Evangelist Director, Tableau. Welcome to Best of Tableau Web! In just 20 minutes, the three finalists, Lisa Trescott, Pradeep Kumar G, and Samuel Parsons, will build their best data visualizations under the watchful eyes of our judges. Klassen and Tudorancea/Tableau Public]. Felicia Styer , Playfair Data.
Continuous Integration and Continuous Delivery (CI/CD) for Data Pipelines: It is a Game-Changer with AnalyticsCreator! The need for efficient and reliable data pipelines is paramount in datascience and data engineering. Data Lakes : It supports MS Azure Blob Storage. pipelines, Azure Data Bricks.
A plethora of datascience and business intelligence professionals and organizations have asked. What’s the best Business Intelligence and Analytics tool in the market? The post Gartner’s 2020 Magic Quadrant is Out! Check out the latest developments in Best Analytics Tools appeared first on Analytics Vidhya.
The ability to pull together data generated by every customer interaction will help you better anticipate customer needs and deliver integrated experiences. Today, we’re excited to announce the launch of the Tableau native connector to Salesforce CDP , an enterprise customer data platform built on the world’s leading CRM.
We organize all of the trending information in your field so you don't have to. Join 17,000+ users and stay up to date on the latest articles your peers are reading.
You know about us, now we want to get to know you!
Let's personalize your content
Let's get even more personalized
We recognize your account from another site in our network, please click 'Send Email' below to continue with verifying your account and setting a password.


Let's personalize your content