This site uses cookies to improve your experience. To help us insure we adhere to various privacy regulations, please select your country/region of residence. If you do not select a country, we will assume you are from the United States. Select your Cookie Settings or view our Privacy Policy and Terms of Use.
Cookie Settings
Cookies and similar technologies are used on this website for proper function of the website, for tracking performance analytics and for marketing purposes. We and some of our third-party providers may use cookie data for various purposes. Please review the cookie settings below and choose your preference.
Used for the proper function of the website
Used for monitoring website traffic and interactions
Cookie Settings
Cookies and similar technologies are used on this website for proper function of the website, for tracking performance analytics and for marketing purposes. We and some of our third-party providers may use cookie data for various purposes. Please review the cookie settings below and choose your preference.
Strictly Necessary: Used for the proper function of the website
Performance/Analytics: Used for monitoring website traffic and interactions
In this blog, we will discuss exploratory data analysis, also known as EDA, and why it is important. EDA is an iterative process of conglomerative activities which include data cleaning, manipulation and visualization. We will also be sharing code snippets so you can try out different analysis techniques yourself.
ArticleVideo Book This article was published as a part of the Data Science Blogathon Overview Python Pandas library is becoming most popular between datascientists. The post EDA – Exploratory Data Analysis Using Python Pandas and SQL appeared first on Analytics Vidhya.
Similarly, if a DataScientist. The post An Efficient way of performing EDA- Hypothesis Generation appeared first on Analytics Vidhya. Introduction- One who knows how to improvise and can deal with all kinds of situations is a winner, right?
This article was published as a part of the Data Science Blogathon What is EDA(Exploratory data analysis)? Exploratory data analysis is a great way of understanding and analyzing the data sets.
Today’s question is, “What does a datascientist do.” ” Step into the realm of data science, where numbers dance like fireflies and patterns emerge from the chaos of information. In this blog post, we’re embarking on a thrilling expedition to demystify the enigmatic role of datascientists.
This means that you can use natural language prompts to perform advanced data analysis tasks, generate visualizations, and train machine learning models without the need for complex coding knowledge. Data manipulation: You can use the plugin to perform data cleaning, transformation, and feature engineering tasks.
Introduction As a datascientist, you have the power to revolutionize the real estate industry by developing models that can accurately predict house prices. Get ready to learn about data collection and analysis, model selection, and […] The post How to Build a Real Estate Price Prediction Model?
The importance of EDA in the machine learning world is well known to its users. Making visualizations is one of the finest ways for datascientists to explain data analysis to people outside the business. Exploratory data analysis can help you comprehend your data better, which can aid in future data preprocessing.
While machine learning frameworks and platforms like PyTorch, TensorFlow, and scikit-learn can perform data exploration well, it’s not their primary intent. There are also plenty of datavisualization libraries available that can handle exploration like Plotly, matplotlib, D3, Apache ECharts, Bokeh, etc.
This article seeks to also explain fundamental topics in data science such as EDA automation, pipelines, ROC-AUC curve (how results will be evaluated), and Principal Component Analysis in a simple way. One important stage of any data analysis/science project is EDA. Exploratory Data Analysis is a pre-study.
Unfolding the difference between data engineer, datascientist, and data analyst. Data engineers are essential professionals responsible for designing, constructing, and maintaining an organization’s data infrastructure. Role of DataScientistsDataScientists are the architects of data analysis.
Answering one of the most common questions I get asked as a Senior DataScientist — What skills and educational background are necessary to become a datascientist? Photo by Eunice Lituañas on Unsplash To become a datascientist, a combination of technical skills and educational background is typically required.
Introduction Data preprocessing is a critical step in the Machine Learning pipeline, transforming raw data into a clean and usable format. With the explosion of data in recent years, it has become essential for datascientists and Machine Learning practitioners to understand and effectively apply preprocessing techniques.
It combines elements of statistics, mathematics, computer science, and domain expertise to extract meaningful patterns from large volumes of data. Role of DataScientists in Modern Industries DataScientists drive innovation and competitiveness across industries in today’s fast-paced digital world.
Data preprocessing ensures the removal of incorrect, incomplete, and inaccurate data from datasets, leading to the creation of accurate and useful datasets for analysis ( Image Credit ) Data completeness One of the primary requirements for data preprocessing is ensuring that the dataset is complete, with minimal missing values.
Fantasy Football is a popular pastime for a large amount of the world, we gathered data around the past 6 seasons of player performance data to see what our community of datascientists could create. This report took the data set provided in the challenge, as well as external data feeds and alternative sources.
Overview This data challenge leaped into the fascinating world of automobile reviews with the “AutoInsight Challenge.” Here datascientists could explore, analyze, and uncover the data’s myriad stories and insights directly from Doug’s scoring metrics.
It simplifies the creation of complex visualisations, making it a go-to tool for DataScientists and analysts. Seaborn integrates seamlessly with Pandas data structures, allowing users to create plots directly from DataFrame objects. Key Features Simplicity and Speed: Focused on quick and easy datavisualization capabilities.
As a datascientist at Cars4U, I had to come up with a pricing model that can effectively predict the price of used cars and can help the business in devising profitable strategies using differential pricing. These are common Python libraries used for data analysis and visualization.
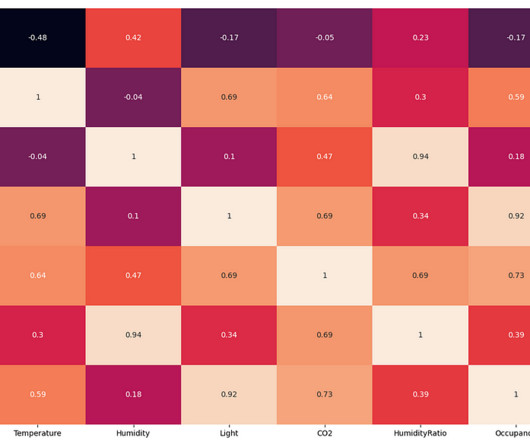
From the above EDA, it is clear that the room's temperature, light, and CO2 levels are good occupancy indicators. Editorially independent, Heartbeat is sponsored and published by Comet, an MLOps platform that enables datascientists & ML teams to track, compare, explain, & optimize their experiments.
We organize all of the trending information in your field so you don't have to. Join 17,000+ users and stay up to date on the latest articles your peers are reading.
You know about us, now we want to get to know you!
Let's personalize your content
Let's get even more personalized
We recognize your account from another site in our network, please click 'Send Email' below to continue with verifying your account and setting a password.


Let's personalize your content