This site uses cookies to improve your experience. To help us insure we adhere to various privacy regulations, please select your country/region of residence. If you do not select a country, we will assume you are from the United States. Select your Cookie Settings or view our Privacy Policy and Terms of Use.
Cookie Settings
Cookies and similar technologies are used on this website for proper function of the website, for tracking performance analytics and for marketing purposes. We and some of our third-party providers may use cookie data for various purposes. Please review the cookie settings below and choose your preference.
Used for the proper function of the website
Used for monitoring website traffic and interactions
Cookie Settings
Cookies and similar technologies are used on this website for proper function of the website, for tracking performance analytics and for marketing purposes. We and some of our third-party providers may use cookie data for various purposes. Please review the cookie settings below and choose your preference.
Strictly Necessary: Used for the proper function of the website
Performance/Analytics: Used for monitoring website traffic and interactions
This article was published as a part of the Data Science Blogathon What is EDA(Exploratorydataanalysis)? Exploratorydataanalysis is a great way of understanding and analyzing the data sets. The post ExploratoryDataAnalysis on UBER Stocks Dataset appeared first on Analytics Vidhya.
ArticleVideo Book This article was published as a part of the Data Science Blogathon Overview Python Pandas library is becoming most popular between datascientists. The post EDA – ExploratoryDataAnalysis Using Python Pandas and SQL appeared first on Analytics Vidhya.
In this blog, we will discuss exploratorydataanalysis, also known as EDA, and why it is important. We will also be sharing code snippets so you can try out different analysis techniques yourself. This can be useful for identifying patterns and trends in the data. So, without any further ado let’s dive right in.
Exploratorydataanalysis (EDA) is a critical component of data science that allows analysts to delve into datasets to unearth the underlying patterns and relationships within. EDA serves as a bridge between raw data and actionable insights, making it essential in any data-driven project.
As data science evolves and grows, the demand for skilled datascientists is also rising. A datascientist’s role is to extract insights and knowledge from data and to use this information to inform decisions and drive business growth.
Datascientists play a crucial role in today’s data-driven world, where extracting meaningful insights from vast amounts of information is key to organizational success. Their work blends statistical analysis, machine learning, and domain expertise to guide strategic decisions across various industries.
This means that you can use natural language prompts to perform advanced dataanalysis tasks, generate visualizations, and train machine learning models without the need for complex coding knowledge. Data manipulation: You can use the plugin to perform data cleaning, transformation, and feature engineering tasks.
Machine learning engineer vs datascientist: two distinct roles with overlapping expertise, each essential in unlocking the power of data-driven insights. As businesses strive to stay competitive and make data-driven decisions, the roles of machine learning engineers and datascientists have gained prominence.
Today’s question is, “What does a datascientist do.” ” Step into the realm of data science, where numbers dance like fireflies and patterns emerge from the chaos of information. In this blog post, we’re embarking on a thrilling expedition to demystify the enigmatic role of datascientists.
Four Essential Tools Every DataScientist Should Have in Their Toolbox This member-only story is on us. Photo by Adam Śmigielski on Unsplash It’s a great time to be a datascientist! Last Updated on September 8, 2023 by Editorial Team Author(s): Francis Adrian Viernes Originally published on Towards AI.
It could explain how these distributions are used in different machine learning algorithms and why understanding them is crucial for datascientists. 32 datasets to uplift your skills in data science Data Science Dojo has created an archive of 32 data sets for you to use to practice and improve your skills as a datascientist.
Similarly, if a DataScientist. Introduction- One who knows how to improvise and can deal with all kinds of situations is a winner, right? The post An Efficient way of performing EDA- Hypothesis Generation appeared first on Analytics Vidhya.
t-SNE (t-distributed stochastic neighbor embedding) has become an essential tool in the realm of data analytics, standing out for its ability to unravel the complexities inherent in high-dimensional data.
Making visualizations is one of the finest ways for datascientists to explain dataanalysis to people outside the business. Exploratorydataanalysis can help you comprehend your data better, which can aid in future data preprocessing. ExploratoryDataAnalysis What is EDA?
Unlocking Time Series Insights: Dive into 5 Free and Practical Kaggle Notebooks to Kickstart Your Analysis Time series data is one of the most common data types in the industry, and you will probably be working with it in your career.
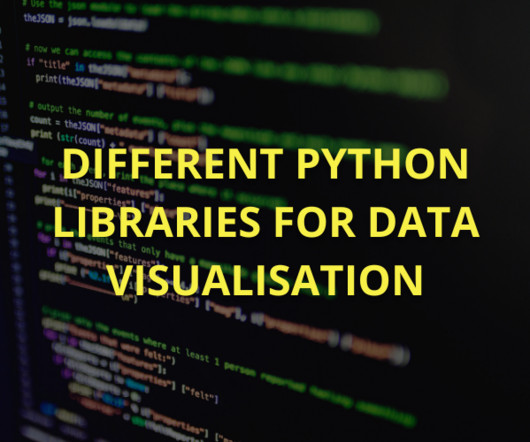
While machine learning frameworks and platforms like PyTorch, TensorFlow, and scikit-learn can perform data exploration well, it’s not their primary intent. There are also plenty of datavisualization libraries available that can handle exploration like Plotly, matplotlib, D3, Apache ECharts, Bokeh, etc.
From Solo Notebooks to Collaborative Powerhouse: VS Code Extensions for Data Science and ML Teams Photo by Parabol | The Agile Meeting Toolbox on Unsplash In this article, we will explore the essential VS Code extensions that enhance productivity and collaboration for datascientists and machine learning (ML) engineers.
It could explain how these distributions are used in different machine learning algorithms and why understanding them is crucial for datascientists. The data sets are categorized according to varying difficulty levels to be suitable for everyone.
Some of the applications of data science are driverless cars, gaming AI, movie recommendations, and shopping recommendations. Since the field covers such a vast array of services, datascientists can find a ton of great opportunities in their field. Datascientists use algorithms for creating data models.
The final point to which the data has to be eventually transferred is a destination. The destination is decided by the use case of the data pipeline. It can be used to run analytical tools and power datavisualization as well. Otherwise, it can also be moved to a storage centre like a data warehouse or lake.
Learn how DataScientists use ChatGPT, a potent OpenAI language model, to improve their operations. ChatGPT is essential in the domains of natural language processing, modeling, dataanalysis, data cleaning, and datavisualization. It facilitates exploratoryDataAnalysis and provides quick insights.
Summary: This blog provides a comprehensive roadmap for aspiring Azure DataScientists, outlining the essential skills, certifications, and steps to build a successful career in Data Science using Microsoft Azure. This roadmap aims to guide aspiring Azure DataScientists through the essential steps to build a successful career.
Principal component analysis (PCA) is a powerful technique that has transformed the way datascientists process and analyze information. Simplifying data without losing information: PCA aims to reduce the number of variables while maintaining the important characteristics of the dataset.
Figure 3: The required python libraries The problem presented to us is a predictive analysis problem which means that we will be heavily involved in finding patterns and predictions rather than seeking recommendations. One important stage of any dataanalysis/science project is EDA. ExploratoryDataAnalysis is a pre-study.
Answering one of the most common questions I get asked as a Senior DataScientist — What skills and educational background are necessary to become a datascientist? Photo by Eunice Lituañas on Unsplash To become a datascientist, a combination of technical skills and educational background is typically required.
Unfolding the difference between data engineer, datascientist, and data analyst. Data engineers are essential professionals responsible for designing, constructing, and maintaining an organization’s data infrastructure. Role of DataScientistsDataScientists are the architects of dataanalysis.
With the help of Tableau, organisations have been able to mine and gather actionable insights from granular sources of data. Tableau can help DataScientists generate graphs, charts, maps and data-driven stories, etc for purpose of visualisation and analysing data.
Data Wrangler simplifies the data preparation and feature engineering process, reducing the time it takes from weeks to minutes by providing a single visual interface for datascientists to select and clean data, create features, and automate data preparation in ML workflows without writing any code.
Data preprocessing ensures the removal of incorrect, incomplete, and inaccurate data from datasets, leading to the creation of accurate and useful datasets for analysis ( Image Credit ) Data completeness One of the primary requirements for data preprocessing is ensuring that the dataset is complete, with minimal missing values.
For instance, if datascientists were building a model for tornado forecasting, the input variables might include date, location, temperature, wind flow patterns and more, and the output would be the actual tornado activity recorded for those days. the target or outcome variable is known).
Data science equips you with the tools and techniques to manage big data, perform exploratorydataanalysis, and extract meaningful information from complex datasets. Making data-driven decisions: Data science empowers you to make informed decisions by analyzing and interpreting data.
It combines elements of statistics, mathematics, computer science, and domain expertise to extract meaningful patterns from large volumes of data. Role of DataScientists in Modern Industries DataScientists drive innovation and competitiveness across industries in today’s fast-paced digital world.
Introduction Data preprocessing is a critical step in the Machine Learning pipeline, transforming raw data into a clean and usable format. With the explosion of data in recent years, it has become essential for datascientists and Machine Learning practitioners to understand and effectively apply preprocessing techniques.
Fantasy Football is a popular pastime for a large amount of the world, we gathered data around the past 6 seasons of player performance data to see what our community of datascientists could create. This report took the data set provided in the challenge, as well as external data feeds and alternative sources.
It simplifies the creation of complex visualisations, making it a go-to tool for DataScientists and analysts. Seaborn integrates seamlessly with Pandas data structures, allowing users to create plots directly from DataFrame objects. Key Features Simplicity and Speed: Focused on quick and easy datavisualization capabilities.
A Introduction to HiPlot for DataAnalysis and Machine Learning Image by Author with @MidJourney Introduction Datavisualization is an essential tool for understanding complex datasets. Overall, this article aims to provide a comprehensive guide to using HiPlot for datavisualization and analysis.
It provides functions for descriptive statistics, hypothesis testing, regression analysis, time series analysis, survival analysis, and more. Packages like dplyr, data.table, and sparklyr enable efficient data processing on big data platforms such as Apache Hadoop and Apache Spark.
This Data Science and Machine Learning course encompass all the fundamentals of both these technologies. Thus making it a perfect choice for individuals who are working in this domain and all looking to excel as DataScientists. The program is open to all and even freshers who are completely new to the world of Data Science.
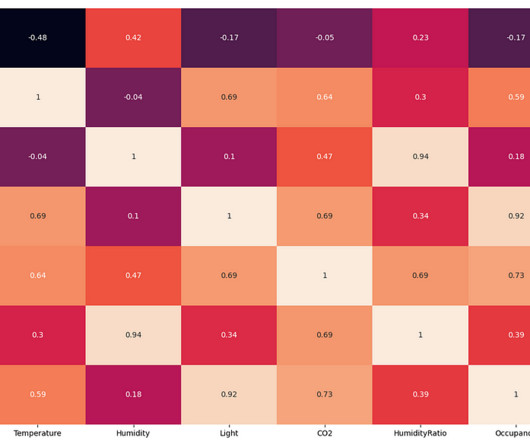
The exploratorydataanalysis found that the change in room temperature, CO levels, and light intensity can be used to predict the occupancy of the room in place of humidity and humidity ratio. We will also be looking at the correlation between the variables. We pay our contributors, and we don't sell ads.
Overview This data challenge leaped into the fascinating world of automobile reviews with the “AutoInsight Challenge.” Here datascientists could explore, analyze, and uncover the data’s myriad stories and insights directly from Doug’s scoring metrics.
Plotly allows developers to embed interactive features such as zooming, panning, and hover effects directly into the plots, making it ideal for ExploratoryDataAnalysis and dynamic reports. DataScientists often use Dash to build real-time analytics dashboards that track key performance metrics.
I will start by looking at the data distribution, followed by the relationship between the target variable and independent variables. Editorially independent, Heartbeat is sponsored and published by Comet, an MLOps platform that enables datascientists & ML teams to track, compare, explain, & optimize their experiments.
This comprehensive blog outlines vital aspects of Data Analyst interviews, offering insights into technical, behavioural, and industry-specific questions. It covers essential topics such as SQL queries, datavisualization, statistical analysis, machine learning concepts, and data manipulation techniques.
As a datascientist at Cars4U, I had to come up with a pricing model that can effectively predict the price of used cars and can help the business in devising profitable strategies using differential pricing. In this analysis, I: provided summary statistics and exploratorydataanalysis of the data.
We organize all of the trending information in your field so you don't have to. Join 17,000+ users and stay up to date on the latest articles your peers are reading.
You know about us, now we want to get to know you!
Let's personalize your content
Let's get even more personalized
We recognize your account from another site in our network, please click 'Send Email' below to continue with verifying your account and setting a password.


Let's personalize your content