This site uses cookies to improve your experience. To help us insure we adhere to various privacy regulations, please select your country/region of residence. If you do not select a country, we will assume you are from the United States. Select your Cookie Settings or view our Privacy Policy and Terms of Use.
Cookie Settings
Cookies and similar technologies are used on this website for proper function of the website, for tracking performance analytics and for marketing purposes. We and some of our third-party providers may use cookie data for various purposes. Please review the cookie settings below and choose your preference.
Used for the proper function of the website
Used for monitoring website traffic and interactions
Cookie Settings
Cookies and similar technologies are used on this website for proper function of the website, for tracking performance analytics and for marketing purposes. We and some of our third-party providers may use cookie data for various purposes. Please review the cookie settings below and choose your preference.
Strictly Necessary: Used for the proper function of the website
Performance/Analytics: Used for monitoring website traffic and interactions
Want to know how to become a Datascientist? Use data to uncover patterns, trends, and insights that can help businesses make better decisions. A datascientist could analyze sales data, customer surveys, and social media trends to determine the reason. It’s like deciphering a secret code.
For datascientists, this shift has opened up a global market of remote data science jobs, with top employers now prioritizing skills that allow remote professionals to thrive. Here’s everything you need to know to land a remote data science job, from advanced role insights to tips on making yourself an unbeatable candidate.
Datavisualization is the art of presenting complex information in a way that is easy to understand and analyze. With the explosion of data in today’s business world, the ability to create compelling datavisualizations has become a critical skill for anyone working with data.
Datascientists use data to uncover patterns, trends, and insights that can help businesses make better decisions. A datascientist could analyze sales data, customer surveys, and social media trends to determine the reason. Handling Uncertainty: Data is often messy and incomplete.
If you’ve found yourself asking, “How to become a datascientist?” In this detailed guide, we’re going to navigate the exciting realm of data science, a field that blends statistics, technology, and strategic thinking into a powerhouse of innovation and insights. What is a datascientist?
As a result, many prioritized and elevated the focus on data skills to nurture and strengthen their organizational behaviors, processes, and mindsets to become data-leading instead of data-lagging. . Learn the data skills that are in demand . Employers are looking for data skills; in fact they’re hungry for them.
As a result, many prioritized and elevated the focus on data skills to nurture and strengthen their organizational behaviors, processes, and mindsets to become data-leading instead of data-lagging. . Learn the data skills that are in demand . Employers are looking for data skills; in fact they’re hungry for them.
print(llm("Suggest 3 bday gifts for a datascientist"))>>> 1. A subscription to a data science magazine or journal2. A set of data science books3. A data science-themed mug or t-shirt As you can see, we initialize an LLM and call it with a query. turbo", temperature=0.01)conversation_history
For budding datascientists and data analysts, there are mountains of information about why you should learn R over Python and the other way around. Though both are great to learn, what gets left out of the conversation is a simple yet powerful programming language that everyone in the data science world can agree on, SQL.
Tableau is a data visualisation software helping you to generate graphics-rich reporting and analysing enormous volumes of data. With the help of Tableau, organisations have been able to mine and gather actionable insights from granular sources of data. Let’s read the blog to find out!
Key Tools and Techniques Business Analytics employs various tools and techniques to process and interpret data effectively. Dashboards, such as those built using Tableau or Power BI , provide real-time visualizations that help track key performance indicators (KPIs). DataScientists require a robust technical foundation.
Steps to Perform DataVisualization: Datavisualization is the presentation of information and statistics using visual tools that include charts, graphs, and maps. Its goal is to create patterns in data, trends, and anomalies comprehensible to both data professionals and people without technical knowledge.
Be sure to check out his talk, “ A Practical Introduction to DataVisualization for DataScientists ,” there! There are many ways to create visualizations, between chart choosers, chart wizards, GUI-based tools of various flavors, and of course, many libraries if you’re looking to use code.
If you’re an aspiring professional in the technological world and love to play with numbers and codes, you have two career paths- Data Analyst and DataScientist. What are the critical differences between Data Analyst vs DataScientist? Who is a DataScientist? Who is a Data Analyst?
In the world of datavisualization , the ability to produce material that can speak to your audience, regardless of their technical expertise, is an ever-important factor to consider. Tableau Public Tableau Public , a powerful datavisualization software, empowers users to create interactive and shareable dashboards with ease.
Data science bootcamps are intensive short-term educational programs designed to equip individuals with the skills needed to enter or advance in the field of data science. They cover a wide range of topics, ranging from Python, R, and statistics to machine learning and datavisualization.
Whether you are a DataScientist or a college student, the LinkedIn platform can give you a plethora of options to explore and grow. In this blog, we will be uncovering the how you can optimize DataScientist LinkedIn profile for Indian market , as well as approach a global audience.
The role of a datascientist is in demand and 2023 will be no exception. To get a better grip on those changes we reviewed over 25,000 datascientist job descriptions from that past year to find out what employers are looking for in 2023. Data Science Of course, a datascientist should know data science!
A DataScientist’s average salary in India is up to₹ 8.0 Well, one of the key factors drawing attention towards the DataScientist job profile is the higher pay package. In fact, the highest salary of a DataScientist in India can be up to ₹ 26.0 DataScientist Salary in Hyderabad : ₹ 8.0
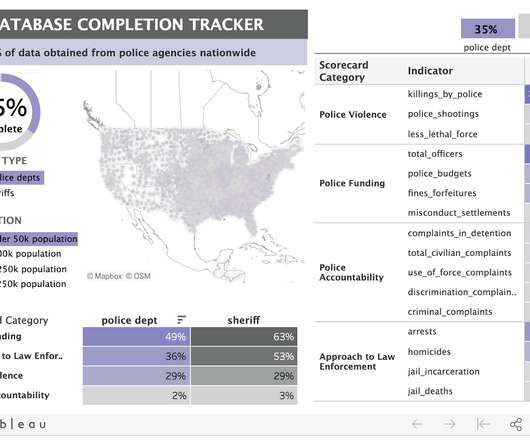
Public Affairs Specialist at Tableau. Visualization credit: Police Scorecard. As part of our Racial Equality and Justice Taskforce ’s policy priorities, Salesforce supports accurate and transparent data collection as part of our police and criminal justice reform work. The role of visualization. Eillie Anzilotti.
Senior Manager Inclusive Marketing, Tableau. Can you picture a world where data storytelling does no harm? The Tableau Foundation has collaborated with The Urban Institute to bring to you the Do No Harm Guide : Applying Equity Awareness in DataVisualization. SENIOR DATASCIENTIST, NATERA. Alice Feng.
Senior DataVisualization Lead, Excella. Once we find issues of inequality in data, it’s also our responsibility to spend time to understand the causes of those inequalities.” - Amanda Makulec. At no point in recent memory has the sheer quantity of available data and datavisualizations on a single topic evolved so quickly.
If you are a Data Science aspirant and want to know how to become a DataScientist in 2023, this is your guide. The following blog post would naturally cover all the important aspects of becoming a DataScientist including a step-by-step guide on the same. What does a DataScientist do?
There are many well-known libraries and platforms for data analysis such as Pandas and Tableau, in addition to analytical databases like ClickHouse, MariaDB, Apache Druid, Apache Pinot, Google BigQuery, Amazon RedShift, etc. Datavisualization can help here by visualizing your datasets.
Are you an aspiring datascientist , or just want to understand the benefits of integrating data catalogs with visualization tools? In today’s ever-growing world of data, having an easy way to gain insights quickly is essential. It helps them effectively capture, store, manage, and share data assets.
Public Affairs Specialist at Tableau. Visualization credit: Police Scorecard. As part of our Racial Equality and Justice Taskforce ’s policy priorities, Salesforce supports accurate and transparent data collection as part of our police and criminal justice reform work. The role of visualization. Eillie Anzilotti.
Here are some of the key features of open source BI software: Data integration: Open source BI software can pull data from various sources, such as databases, spreadsheets, and cloud services, and integrate it into a single location for analysis.
The post A Comprehensive Step-by-Step Guide to Become an Industry Ready Data Science Professional appeared first on Analytics Vidhya. ArticleVideo Book Introduction to Artificial Intelligence and Machine Learning Artificial Intelligence (AI) and its sub-field Machine Learning (ML) have taken the world by storm.
One of the biggest benefits of Tableau is that the software is free and extremely versatile. It can connect any data source, although the better your source, the better the results will be. It can connect any data source, although the better your source, the better the results will be. RapidMiner.
Overview: Data science vs data analytics Think of data science as the overarching umbrella that covers a wide range of tasks performed to find patterns in large datasets, structure data for use, train machine learning models and develop artificial intelligence (AI) applications.
Heres what we noticed from analyzing this data, highlighting whats remained the same over the years, and what additions help make the modern datascientist in2025. Data Science Of course, a datascientist should know data science! Joking aside, this does infer particular skills.
Are you an aspiring datascientist , or just want to understand the benefits of integrating data catalogs with visualization tools? In today’s ever-growing world of data, having an easy way to gain insights quickly is essential. It helps them effectively capture, store, manage, and share data assets.
Data engineering can be interpreted as learning the moral of the story. Welcome to the mini tour of data engineering where we will discover how a data engineer is different from a datascientist and analyst. Processes like exploring, cleaning, and transforming the data that make the data as efficient as possible.
Summary: The role of a DataScientist has emerged as one of the most coveted and lucrative professions across industries. Combining a blend of technical and non-technical skills, a DataScientist navigates through vast datasets, extracting valuable insights that drive strategic decisions.
Unfolding the difference between data engineer, datascientist, and data analyst. Data engineers are essential professionals responsible for designing, constructing, and maintaining an organization’s data infrastructure. Role of DataScientistsDataScientists are the architects of data analysis.
The post A Comprehensive Step-by-Step Guide to Become an Industry-Ready Data Science Professional appeared first on Analytics Vidhya. Introduction to Artificial Intelligence and Machine Learning Artificial Intelligence (AI) and its sub-field Machine Learning (ML) have taken the world by storm.
Data professionals are in high demand all over the globe due to the rise in big data. The roles of datascientists and data analysts cannot be over-emphasized as they are needed to support decision-making. This article will serve as an ultimate guide to choosing between Data Science and Data Analytics.
GenAI I serve as the Principal DataScientist at a prominent healthcare firm, where I lead a small team dedicated to addressing patient needs. Over the past 11 years in the field of data science, I’ve witnessed significant transformations.
To influence change and advance the understanding of what it means to use data with empathy and fairness, the Urban Institute, in partnership with Tableau Foundation , created the “ Do No Harm Guide: Applying Equity Awareness in DataVisualization. Urban Institute, recreated from Tableau dashboard].
Data preprocessing ensures the removal of incorrect, incomplete, and inaccurate data from datasets, leading to the creation of accurate and useful datasets for analysis ( Image Credit ) Data completeness One of the primary requirements for data preprocessing is ensuring that the dataset is complete, with minimal missing values.
To influence change and advance the understanding of what it means to use data with empathy and fairness, the Urban Institute, in partnership with Tableau Foundation , created the “ Do No Harm Guide: Applying Equity Awareness in DataVisualization. Urban Institute, recreated from Tableau dashboard].
With the abundance of data available, organizations across various industries are leveraging data science to gain valuable insights and make informed decisions. Pursuing a data science certification course makes you eligible to get the best Data Science salary in India. What is Data Science?
Senior Manager Inclusive Marketing, Tableau. Can you picture a world where data storytelling does no harm? The Tableau Foundation has collaborated with The Urban Institute to bring to you the Do No Harm Guide : Applying Equity Awareness in DataVisualization. SENIOR DATASCIENTIST, NATERA. Alice Feng.
Senior DataVisualization Lead, Excella. Once we find issues of inequality in data, it’s also our responsibility to spend time to understand the causes of those inequalities.” - Amanda Makulec. At no point in recent memory has the sheer quantity of available data and datavisualizations on a single topic evolved so quickly.
We organize all of the trending information in your field so you don't have to. Join 17,000+ users and stay up to date on the latest articles your peers are reading.
You know about us, now we want to get to know you!
Let's personalize your content
Let's get even more personalized
We recognize your account from another site in our network, please click 'Send Email' below to continue with verifying your account and setting a password.


Let's personalize your content