This site uses cookies to improve your experience. To help us insure we adhere to various privacy regulations, please select your country/region of residence. If you do not select a country, we will assume you are from the United States. Select your Cookie Settings or view our Privacy Policy and Terms of Use.
Cookie Settings
Cookies and similar technologies are used on this website for proper function of the website, for tracking performance analytics and for marketing purposes. We and some of our third-party providers may use cookie data for various purposes. Please review the cookie settings below and choose your preference.
Used for the proper function of the website
Used for monitoring website traffic and interactions
Cookie Settings
Cookies and similar technologies are used on this website for proper function of the website, for tracking performance analytics and for marketing purposes. We and some of our third-party providers may use cookie data for various purposes. Please review the cookie settings below and choose your preference.
Strictly Necessary: Used for the proper function of the website
Performance/Analytics: Used for monitoring website traffic and interactions
Want to know how to become a Datascientist? Use data to uncover patterns, trends, and insights that can help businesses make better decisions. A datascientist could analyze sales data, customer surveys, and social media trends to determine the reason. It’s like deciphering a secret code.
For datascientists, this shift has opened up a global market of remote data science jobs, with top employers now prioritizing skills that allow remote professionals to thrive. Here’s everything you need to know to land a remote data science job, from advanced role insights to tips on making yourself an unbeatable candidate.
Datascientists use data to uncover patterns, trends, and insights that can help businesses make better decisions. A datascientist could analyze sales data, customer surveys, and social media trends to determine the reason. Handling Uncertainty: Data is often messy and incomplete.
If you’ve found yourself asking, “How to become a datascientist?” In this detailed guide, we’re going to navigate the exciting realm of data science, a field that blends statistics, technology, and strategic thinking into a powerhouse of innovation and insights. What is a datascientist?
Spencer Czapiewski August 6, 2024 - 6:34pm Kyle Massey VP Lead Software Engineer Kyle Massey, a two-time Tableau DataDev Ambassador and co-leader of the DataPride Tableau User Group, shares his experience with VizQL Data Service. What is VizQL Data Service? And boy oh boy, did it catch my eye right away!
Chief Technology Officer, Tableau. One of the things we’re focused on at Tableau is how to get more people using data in the daily routine of business. We want to reduce those barriers by introducing a new class of analytics: Tableau Business Science. What is Tableau Business Science? Andrew Beers. March 23, 2021.
Swetha Bezawada Senior DataScientist Colten Woo September 26, 2023 - 6:57pm October 2, 2023 The typical analytical ecosystem has two silos: business intelligence and data science. Datascientists have a wide range of options to choose from when it comes to programming languages and platforms to build their predictive models.
Product Marketing Specialist, Tableau. The newest release of Tableau is here! Tableau 2021.1 Upgrade to take advantage of these new innovations, and learn more about how Tableau brings AI into analytics to help users across your organization answer pressing questions. In Tableau 2021.1, In Tableau 2021.1,
Brand Marketing Intern at Tableau, A Salesforce Company. The academic and professional worlds may not always be on the same page when it comes to equipping the incoming workforce with data skills. As the data shows us, there’s room for improvement in closing the data literacy gap. Gabby Isaguirre. Kristin Adderson.
The pandemic further highlighted that speed, agility, and empowerment are critical to success—and companies that embrace a data culture adapt, learn, and deliver more value than those that don't. . At Tableau, we believe that data is the lifeblood of an organization. Manage all of your data with a single pane of glass.
As a result, many prioritized and elevated the focus on data skills to nurture and strengthen their organizational behaviors, processes, and mindsets to become data-leading instead of data-lagging. . Learn the data skills that are in demand . Employers are looking for data skills; in fact they’re hungry for them.
Brand Marketing Intern at Tableau, A Salesforce Company. The academic and professional worlds may not always be on the same page when it comes to equipping the incoming workforce with data skills. As the data shows us, there’s room for improvement in closing the data literacy gap. Gabby Isaguirre. Kristin Adderson.
As a result, many prioritized and elevated the focus on data skills to nurture and strengthen their organizational behaviors, processes, and mindsets to become data-leading instead of data-lagging. . Learn the data skills that are in demand . Employers are looking for data skills; in fact they’re hungry for them.
Swetha Bezawada Senior DataScientist Colten Woo September 26, 2023 - 6:57pm October 2, 2023 The typical analytical ecosystem has two silos: business intelligence and data science. Datascientists have a wide range of options to choose from when it comes to programming languages and platforms to build their predictive models.
Chief Product Officer, Tableau. Tableau has been named a Leader in the Gartner Magic Quadrant for Analytics & Business Intelligence Platforms for the 10th consecutive year. We believe a decade as a Leader is an incredible milestone—and it wouldn’t be possible without you, our amazing Tableau Community. . Tanna Solberg.
Chief Product Officer, Tableau. Tableau has been named a Leader in the Gartner Magic Quadrant for Analytics & Business Intelligence Platforms for the 10th consecutive year. We believe a decade as a Leader is an incredible milestone—and it wouldn’t be possible without you, our amazing Tableau Community. . Tanna Solberg.
With the explosion of data in today’s business world, the ability to create compelling data visualizations has become a critical skill for anyone working with data. In this article, we’ll explore the art of data visualization and how it can be used to tell compelling stories with business analytics.
For budding datascientists and data analysts, there are mountains of information about why you should learn R over Python and the other way around. Though both are great to learn, what gets left out of the conversation is a simple yet powerful programming language that everyone in the data science world can agree on, SQL.
Tableau is a data visualisation software helping you to generate graphics-rich reporting and analysing enormous volumes of data. With the help of Tableau, organisations have been able to mine and gather actionable insights from granular sources of data. Let’s read the blog to find out!
Key Tools and Techniques Business Analytics employs various tools and techniques to process and interpret data effectively. Dashboards, such as those built using Tableau or Power BI , provide real-time visualizations that help track key performance indicators (KPIs). DataScientists require a robust technical foundation.
VP Product Management and Data, Tableau. If we’ve learned anything in the past year, it’s how much our progress hinges on the ability to share and collaborate around data. . During the pandemic, we watched as scientists from around the world raced to develop COVID-19 vaccines in record time. Razi Sharir. Brian Dirking.
Chief Product Officer, Tableau. When it comes to asking questions of their data, how comfortable are most people in your organization? Even with a deep understanding of the business, if your users can’t find the right data or navigate dashboards to answer their questions, they aren’t likely to embrace analytics for making decisions.
Summary: Tableau simplifies data visualisation with interactive dashboards, AI-driven insights, and seamless data integration. Introduction Representing the data effectively is an important aspect of work for every DataScientist.
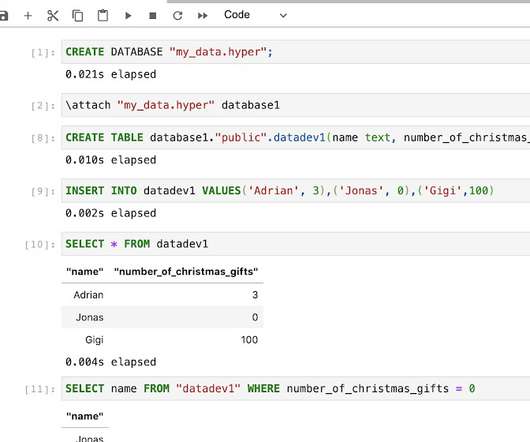
print(llm("Suggest 3 bday gifts for a datascientist"))>>> 1. A subscription to a data science magazine or journal2. A set of data science books3. A data science-themed mug or t-shirt As you can see, we initialize an LLM and call it with a query. turbo", temperature=0.01)conversation_history
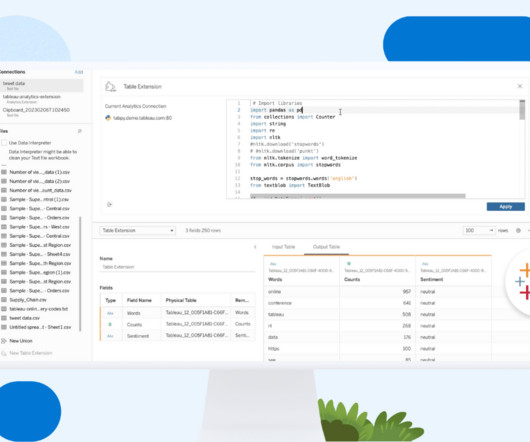
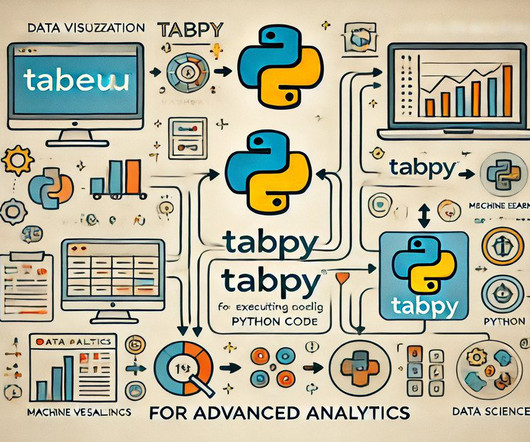
Summary: Incorporating TabPy into Tableau allows users to execute Python scripts directly within their dashboards, significantly enhancing analytical capabilities. One powerful combination is the integration of TabPy (Tableau Python Server) with Tableau , a leading data visualisation tool. Why Use TabPy with Tableau?
Editor's note: This article originally appeared in Forbes , by Olivia Nix, Senior Manager Product Marketing, Tableau. With the acceleration of digital transformation in business, most CTOs, CIOs, and even middle management or analysts are now asking, "What's next with data?" A solution to consider: Tableau Business Science.
If you’re an aspiring professional in the technological world and love to play with numbers and codes, you have two career paths- Data Analyst and DataScientist. What are the critical differences between Data Analyst vs DataScientist? Who is a DataScientist? Let’s find out!
Whether you are a DataScientist or a college student, the LinkedIn platform can give you a plethora of options to explore and grow. In this blog, we will be uncovering the how you can optimize DataScientist LinkedIn profile for Indian market , as well as approach a global audience.
A DataScientist’s average salary in India is up to₹ 8.0 Well, one of the key factors drawing attention towards the DataScientist job profile is the higher pay package. In fact, the highest salary of a DataScientist in India can be up to ₹ 26.0 DataScientist Salary in Hyderabad : ₹ 8.0
Data Science is the process in which collecting, analysing and interpreting large volumes of data helps solve complex business problems. A DataScientist is responsible for analysing and interpreting the data, ensuring it provides valuable insights that help in decision-making.
If you are a Data Science aspirant and want to know how to become a DataScientist in 2023, this is your guide. The following blog post would naturally cover all the important aspects of becoming a DataScientist including a step-by-step guide on the same. What does a DataScientist do?
Summary: Data Science is becoming a popular career choice. Mastering programming, statistics, Machine Learning, and communication is vital for DataScientists. A typical Data Science syllabus covers mathematics, programming, Machine Learning, data mining, big data technologies, and visualisation.
The way to do this today is via impersonation, by which a server admin can impersonate a user, query as that user, and retrieve content that user has access to based on permissions within Tableau. Webhooks is a notification service that allows you to integrate Tableau with any external server. In the 2021.1 Auto-disable Webhooks.
From the democratisation of programming languages and analytics tools to the emergence of datascientists as the key decision influencer of the modern workforce, data science and its underlying methodologies are transforming the face of business. Is artificial intelligence the future of analytics?
Product Marketing Specialist, Tableau. The newest release of Tableau is here! Tableau 2021.1 Upgrade to take advantage of these new innovations, and learn more about how Tableau brings AI into analytics to help users across your organization answer pressing questions. In Tableau 2021.1, In Tableau 2021.1,
Chief Technology Officer, Tableau. One of the things we’re focused on at Tableau is how to get more people using data in the daily routine of business. We want to reduce those barriers by introducing a new class of analytics: Tableau Business Science. What is Tableau Business Science? Andrew Beers. March 23, 2021.
Senior Data Skills Curriculum Strategy Manager, Tableau. The future speaks data—do you? Despite data skills being the most in-demand skill in today’s (and tomorrow’s) job market, there’s still a data literacy gap. . Why you need data skills (and why you need to be proactive about building them). Sue Kraemer.
The pandemic further highlighted that speed, agility, and empowerment are critical to success—and companies that embrace a data culture adapt, learn, and deliver more value than those that don't. . At Tableau, we believe that data is the lifeblood of an organization. Manage all of your data with a single pane of glass.
Senior Data Skills Curriculum Strategy Manager, Tableau. The future speaks data—do you? Despite data skills being the most in-demand skill in today’s (and tomorrow’s) job market, there’s still a data literacy gap. . Why you need data skills (and why you need to be proactive about building them). Sue Kraemer.
Perhaps you’re a datascientist who’s looking for ideas about how to get started with advanced time series forecasting , information about our expanded support for deep learning , or maybe just some ideas on how you can automate some of the data science tasks you dread. Until now.
Editor's note: This article originally appeared in Forbes , by Sarah Nell-Rodriquez, Senior Manager of Customer Success, Tableau. But there's a huge gap: 83% of leaders say they want their organizations to be data-led, but only 33% of employees say they're comfortable working with data. mark nelson , Tableau President & CEO.
Editor's note: This article originally appeared in Forbes , by Sarah Nell-Rodriquez, Senior Manager of Customer Success, Tableau. But there's a huge gap: 83% of leaders say they want their organizations to be data-led, but only 33% of employees say they're comfortable working with data. mark nelson , Tableau President & CEO.
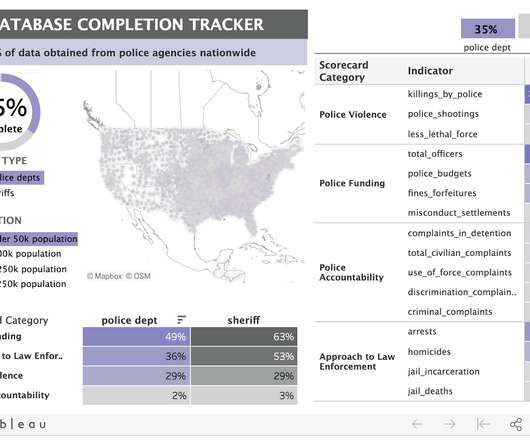
Public Affairs Specialist at Tableau. As part of our Racial Equality and Justice Taskforce ’s policy priorities, Salesforce supports accurate and transparent data collection as part of our police and criminal justice reform work. The underlying dataset for Police Scorecard is massive: over 13 million cells of data and counting.
Senior Product Marketing Manager, Tableau. Also, the exponential amount of data they’re generating creates additional complexity to helping employees use data in their roles. DTDC , a distribution and logistics business based in India, used Tableau to plot data onto a map to better understand the problem of delivery delays.
We organize all of the trending information in your field so you don't have to. Join 17,000+ users and stay up to date on the latest articles your peers are reading.
You know about us, now we want to get to know you!
Let's personalize your content
Let's get even more personalized
We recognize your account from another site in our network, please click 'Send Email' below to continue with verifying your account and setting a password.


Let's personalize your content