This site uses cookies to improve your experience. To help us insure we adhere to various privacy regulations, please select your country/region of residence. If you do not select a country, we will assume you are from the United States. Select your Cookie Settings or view our Privacy Policy and Terms of Use.
Cookie Settings
Cookies and similar technologies are used on this website for proper function of the website, for tracking performance analytics and for marketing purposes. We and some of our third-party providers may use cookie data for various purposes. Please review the cookie settings below and choose your preference.
Used for the proper function of the website
Used for monitoring website traffic and interactions
Cookie Settings
Cookies and similar technologies are used on this website for proper function of the website, for tracking performance analytics and for marketing purposes. We and some of our third-party providers may use cookie data for various purposes. Please review the cookie settings below and choose your preference.
Strictly Necessary: Used for the proper function of the website
Performance/Analytics: Used for monitoring website traffic and interactions
This article was published as a part of the Data Science Blogathon. Introduction Jupyter Notebook is a web-based interactive computing platform that many data scientists use for datawrangling, datavisualization, and prototyping of their Machine Learning models.
Data Analyst Data analysts are responsible for collecting, analyzing, and interpreting large sets of data to identify patterns and trends. They require strong analytical skills, knowledge of statistical analysis, and expertise in datavisualization.
At Springboard , we recently sat down with Michael Beaumier, a data scientist at Google, to discuss his transition into the field, what the interview process is like, the future of datawrangling, and the advice he has for aspiring data professionals. in physics and now you’re a data scientist.
The goal of data cleaning, the data cleaning process, selecting the best programming language and libraries, and the overall methodology and findings will all be covered in this post. Datawrangling requires that you first clean the data.
Data science boot camps are intensive, short-term programs that teach students the skills they need to become data scientists. These programs typically cover topics such as datawrangling, statistical inference, machine learning, and Python programming.
They offer the ability to challenge one’s knowledge and get hands-on practice to boost their skills in areas, including, but not limited to, exploratory data analysis, datavisualization, datawrangling, machine learning, and everything essential to learning data science.
Machine learning practitioners are often working with data at the beginning and during the full stack of things, so they see a lot of workflow/pipeline development, datawrangling, and data preparation. What percentage of machine learning models developed in your organization get deployed to a production environment?
They offer the ability to challenge one’s knowledge and get hands-on practice to boost their skills in areas, including, but not limited to, exploratory data analysis, datavisualization, datawrangling, machine learning, and everything essential to learning data science.
Data scientists try multiple models, evaluate their performance, and fine-tune some parameters to get better accuracy. DataVisualization and Interpretation To make the data understandable to stakeholders, visualizations are created in the form of charts, graphs, and dashboards.
As a data analyst, you will learn several technical skills that data analysts need to be successful, including: Programming skills. Datavisualization capability. Data Mining skills. Datawrangling ability. Machine learning knowledge.
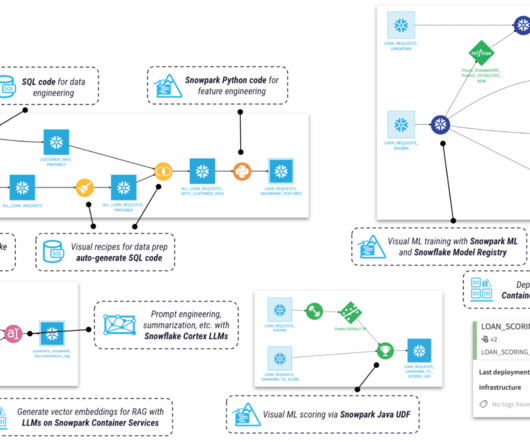
By providing a single, unified platform for data storage, management, and analysis, Snowflake connects organizations to leading software vendors specializing in analytics, machine learning, datavisualization, and more.
They employ statistical and mathematical techniques to uncover patterns, trends, and relationships within the data. Data scientists possess a deep understanding of statistical modeling, datavisualization, and exploratory data analysis to derive actionable insights and drive business decisions.
Analytics and Data Analysis Coming in as the 4th most sought-after skill is data analytics, as many data scientists will be expected to do some analysis in their careers. This doesn’t mean anything too complicated, but could range from basic Excel work to more advanced reporting to be used for datavisualization later on.
We’re still hammering out the details and exact titles, but a tentative list of topics includes: An Introduction to DataWrangling with SQL Programming with Data: Python and Pandas Introduction to Machine Learning Introduction to Math for Data Science Introduction to DataVisualization Day 1: Tuesday, May 9th In-Person Day 1 ODSC East 2023 will feature (..)
Past courses have included An Introduction to DataWrangling with SQL Programming with Data: Python and Pandas Introduction to Machine Learning Introduction to Math for Data Science Introduction to DataVisualization During the conference itself, you’ll have your choice of any of ODSC East’s training sessions, workshops, and talks.
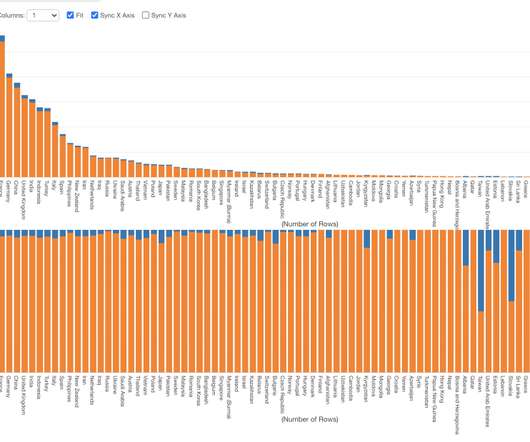
The main things are Performance, Prediction, Summary View’s Correlation Mode, Text DataWrangling UI, and Summarize Table. Performance But the performance to me is probably the most important feature for any data analysis tools. Switching between Data Frames. Moving between the DataWrangling Steps.
Aspiring Data Scientists must equip themselves with a diverse skill set encompassing technical expertise, analytical prowess, and domain knowledge. Whether you’re venturing into machine learning, predictive analytics, or datavisualization, honing the following top Data Science skills is essential for success.
For example, business analysts can use BI dashboards to conduct in-depth business analytics and visualize key performance metrics compiled from relevant datasets. They may also use tools such as Excel to sort, calculate and visualizedata.
Past courses have included An Introduction to DataWrangling with SQL Programming with Data: Python and Pandas Introduction to Machine Learning Introduction to Math for Data Science Introduction to DataVisualization During the conference itself, you’ll have your choice of any of ODSC West’s training sessions, workshops, and talks.
Introduction to Pandas – The fundamentals Pandas is a popular and powerful open-source data analysis and manipulation library for the Python programming language. It is used by us, almighty data scientists and analysts to work with large datasets, perform complex operations, and create powerful datavisualizations.
As you’ll see below, however, a growing number of data analytics platforms, skills, and frameworks have altered the traditional view of what a data analyst is. Data Presentation: Communication Skills, DataVisualization Any good data analyst can go beyond just number crunching.
Analytics Time Series Clustering We have this new analytics capability as a DataWrangling Step in v6.4. Date Format Support for Table You can now apply the date format to your date and time data. DataWrangling Sometimes, you want to summarize for each row. But with v6.5,
Monday’s sessions will cover a wide range of topics, from Generative AI and LLMs to MLOps and DataVisualization. Day 1: Monday, October 30th (Bootcamp, VIP, Platinum) Day 1 of ODSC West 2023 will feature our hands-on training sessions, workshops, and tutorials and will be open to Platinum, Bootcamp, and VIP pass holders.
March 14, 2023: ODSC East Bootcamp Warmup: SQL Primer Course April 6, 2023: ODSC East Bootcamp Warmup: Programming Primer Course with Python April 26, 2023: ODSC East Bootcamp Warmup: AI Primer Course And during ODSC East this May 9th-11th, you can check out these bootcamp-exclusive sessions: An Introduction to DataWrangling with SQL Programming with (..)
Humans and machines Data scientists and analysts need to be aware of how this technology will affect their role, their processes, and their relationships with other stakeholders. There are clearly aspects of datawrangling that AI is going to be good at.
Enroll in data science courses or bootcamps: Participating in structured data science programs specifically designed for non-technical backgrounds can provide you with a comprehensive understanding of the field. Look for programs that cover topics such as machine learning, datavisualization, and predictive modeling.
Improving your data literacy not only involves hard skills, such as programming languages, but soft skills such as interpersonal communication, and stakeholder relations, as well as blended skills such as datavisualization.
Making data-driven decisions: Data science empowers you to make informed decisions by analyzing and interpreting data. Addressing real-world problems: Data science enables you to tackle real-world challenges across diverse domains, such as healthcare, finance, marketing, and social sciences.
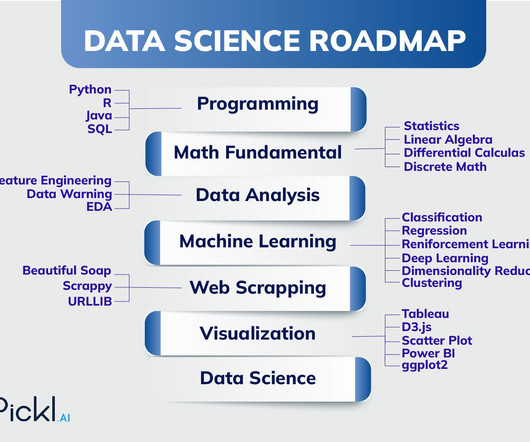
Key Takeaways: Data Science is a multidisciplinary field bridging statistics, mathematics, and computer science to extract insights from data. The roadmap to becoming a Data Scientist involves mastering programming, statistics, machine learning, datavisualization, and domain knowledge.
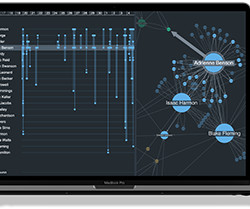
Graph visualization SDKs would have been a huge asset to those projects. To prove this, I built my own digital twin using the KeyLines graph visualization toolkit. Let’s see how advanced datavisualization can illuminate these models and uncover powerful insights. What is a digital twin?
Drag and drop data fields into the “Rows,” “Columns,” “Values,” and “Filters” sections of the PivotTable Fields list to organize and analyze your data. Ensure headers are clear and data types are formatted correctly (currency for “Sales Amount”).
When you import data to Exploratory it used to save the data in a binary format called RDS on the local hard disk. This is the data at the source step (the first step in the right hand side) before any datawrangling. That’s all for the Exploratory v6.1
Let’s look at five benefits of an enterprise data catalog and how they make Alex’s workflow more efficient and her data-driven analysis more informed and relevant. A data catalog replaces tedious request and data-wrangling processes with a fast and seamless user experience to manage and access data products.
Data Cleaning and Transformation Techniques for preprocessing data to ensure quality and consistency, including handling missing values, outliers, and data type conversions. Students should learn about datawrangling and the importance of data quality.
Packages like stats, car, and survival are commonly used for statistical modeling and analysis. · DataVisualization : R offers several libraries, including ggplot2, plotly, and lattice, that allow for the creation of high-quality visualizations.
Descriptive Analytics Projects: These projects focus on summarizing historical data to gain insights into past trends and patterns. Examples include generating reports, dashboards, and datavisualizations to understand business performance, customer behavior, or operational efficiency.
Goal The objective of this post is to demonstrate how Polars performance is much better than other open-source libraries in a variety of data analysis tasks, such as data cleaning, datawrangling, and datavisualization. ?
Data science methodologies and skills can be leveraged to design these experiments, analyze results, and iteratively improve prompt strategies. Using skills such as statistical analysis and datavisualization techniques, prompt engineers can assess the effectiveness of different prompts and understand patterns in the responses.
Here are some details about these packages: jupyterlab is for model building and data exploration. matplotlib is for datavisualization. missingno is for missing values visualization. In your new virtual environment, install the following packages (which include libraries and dependencies): pip3 install jupyterlab==3.4.3
Weka: Features user-friendly data mining processes including pre-processing and classification tasks. Pandas: A crucial library in Python utilized for datawrangling with emphasis on numerical tables and time series data. Effective visualization is crucial for communicating insights to non-technical stakeholders.
Basic tools Using Excel allows for straightforward analyses and quick datavisualizations. Business intelligence tools Advanced applications such as Power BI and Tableau provide sophisticated datavisualization and reporting capabilities.
Mastering tools like LLMs, prompt engineering, and datawrangling is now essential for every modern developer. Exploring Open-Source Innovations: 13 Companies Offering Cutting-Edge Solutions These companies offer unique open-source AI solutions covering everything from datavisualization to AI-powered data labeling andmore.
Data often arrives from multiple sources in inconsistent forms, including duplicate entries from CRM systems, incomplete spreadsheet records, and mismatched naming conventions across databases. These issues slow analysis pipelines and demand time-consuming cleanup.
We organize all of the trending information in your field so you don't have to. Join 17,000+ users and stay up to date on the latest articles your peers are reading.
You know about us, now we want to get to know you!
Let's personalize your content
Let's get even more personalized
We recognize your account from another site in our network, please click 'Send Email' below to continue with verifying your account and setting a password.


Let's personalize your content