This site uses cookies to improve your experience. To help us insure we adhere to various privacy regulations, please select your country/region of residence. If you do not select a country, we will assume you are from the United States. Select your Cookie Settings or view our Privacy Policy and Terms of Use.
Cookie Settings
Cookies and similar technologies are used on this website for proper function of the website, for tracking performance analytics and for marketing purposes. We and some of our third-party providers may use cookie data for various purposes. Please review the cookie settings below and choose your preference.
Used for the proper function of the website
Used for monitoring website traffic and interactions
Cookie Settings
Cookies and similar technologies are used on this website for proper function of the website, for tracking performance analytics and for marketing purposes. We and some of our third-party providers may use cookie data for various purposes. Please review the cookie settings below and choose your preference.
Strictly Necessary: Used for the proper function of the website
Performance/Analytics: Used for monitoring website traffic and interactions
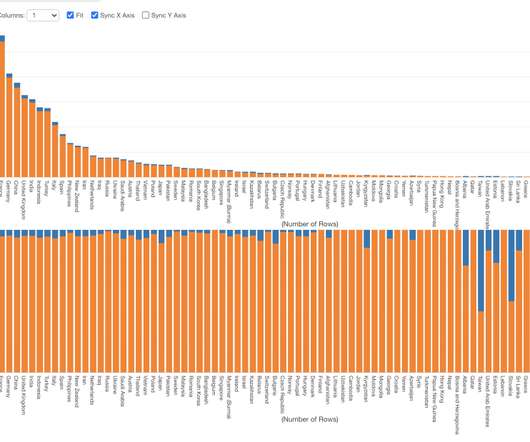
The main things are Performance, Prediction, Summary View’s Correlation Mode, Text DataWrangling UI, and Summarize Table. Performance But the performance to me is probably the most important feature for any data analysis tools. Switching between Data Frames. Moving between the DataWrangling Steps.
Analytics Time Series Clustering We have this new analytics capability as a DataWrangling Step in v6.4. Date Format Support for Table You can now apply the date format to your date and time data. DataWrangling Sometimes, you want to summarize for each row. And, download Exploratory v6.5 But with v6.5,
When you import data to Exploratory it used to save the data in a binary format called RDS on the local hard disk. This is the data at the source step (the first step in the right hand side) before any datawrangling. And, download Exploratory v6.1 from the download page today!
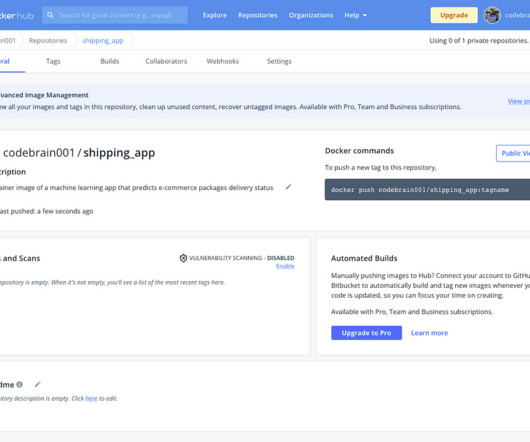
Here are some details about these packages: jupyterlab is for model building and data exploration. matplotlib is for datavisualization. missingno is for missing values visualization. Create a new notebook named dev-notebook, where we will carry out interactive data exploration and model building. Flask==2.1.2
We organize all of the trending information in your field so you don't have to. Join 17,000+ users and stay up to date on the latest articles your peers are reading.
You know about us, now we want to get to know you!
Let's personalize your content
Let's get even more personalized
We recognize your account from another site in our network, please click 'Send Email' below to continue with verifying your account and setting a password.


Let's personalize your content