This site uses cookies to improve your experience. To help us insure we adhere to various privacy regulations, please select your country/region of residence. If you do not select a country, we will assume you are from the United States. Select your Cookie Settings or view our Privacy Policy and Terms of Use.
Cookie Settings
Cookies and similar technologies are used on this website for proper function of the website, for tracking performance analytics and for marketing purposes. We and some of our third-party providers may use cookie data for various purposes. Please review the cookie settings below and choose your preference.
Used for the proper function of the website
Used for monitoring website traffic and interactions
Cookie Settings
Cookies and similar technologies are used on this website for proper function of the website, for tracking performance analytics and for marketing purposes. We and some of our third-party providers may use cookie data for various purposes. Please review the cookie settings below and choose your preference.
Strictly Necessary: Used for the proper function of the website
Performance/Analytics: Used for monitoring website traffic and interactions
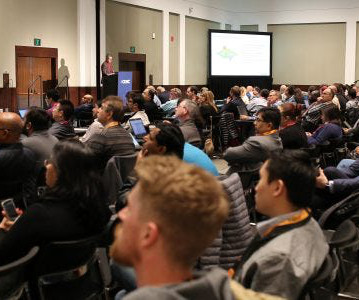
Events with Dates TBD We’re still working out the dates for a few events, but here are some things to come: Meet the Experts | In-Person: Meet the Experts and Speakers brings you up close and personal with some of the biggest names in data science! They will be held virtually on the conference platform.
Past courses have included An Introduction to DataWrangling with SQL Programming with Data: Python and Pandas Introduction to Machine Learning Introduction to Math for Data Science Introduction to DataVisualization During the conference itself, you’ll have your choice of any of ODSC East’s training sessions, workshops, and talks.
Diagnostic analytics: Diagnostic analytics helps pinpoint the reason an event occurred. For example, business analysts can use BI dashboards to conduct in-depth business analytics and visualize key performance metrics compiled from relevant datasets. They may also use tools such as Excel to sort, calculate and visualizedata.
Monday’s sessions will cover a wide range of topics, from Generative AI and LLMs to MLOps and DataVisualization. Finally, get ready for some All Hallows Eve fun with Halloween Data After Dark , featuring a costume contest, candy, and more. What’s next? Register now while tickets are 50% off. Prices go up Friday!
Past courses have included An Introduction to DataWrangling with SQL Programming with Data: Python and Pandas Introduction to Machine Learning Introduction to Math for Data Science Introduction to DataVisualization During the conference itself, you’ll have your choice of any of ODSC West’s training sessions, workshops, and talks.
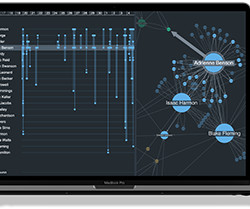
Graph visualization SDKs would have been a huge asset to those projects. To prove this, I built my own digital twin using the KeyLines graph visualization toolkit. Let’s see how advanced datavisualization can illuminate these models and uncover powerful insights. What is a digital twin? Here are the results.
Descriptive Analytics Projects: These projects focus on summarizing historical data to gain insights into past trends and patterns. Examples include generating reports, dashboards, and datavisualizations to understand business performance, customer behavior, or operational efficiency.
Data Streaming Learning about real-time data collection methods using tools like Apache Kafka and Amazon Kinesis. Students should understand the concepts of event-driven architecture and stream processing. Once data is collected, it needs to be stored efficiently.
Data science methodologies and skills can be leveraged to design these experiments, analyze results, and iteratively improve prompt strategies. Using skills such as statistical analysis and datavisualization techniques, prompt engineers can assess the effectiveness of different prompts and understand patterns in the responses.
Here are some details about these packages: jupyterlab is for model building and data exploration. matplotlib is for datavisualization. missingno is for missing values visualization. In your new virtual environment, install the following packages (which include libraries and dependencies): pip3 install jupyterlab==3.4.3
Descriptive analytics is a fascinating area of data analytics that allows businesses to look back and glean insights from their historical data. By summarizing past events and performance metrics, organizations can understand trends, patterns, and behaviors that shape their decision-making processes.
Mastering tools like LLMs, prompt engineering, and datawrangling is now essential for every modern developer. Exploring Open-Source Innovations: 13 Companies Offering Cutting-Edge Solutions These companies offer unique open-source AI solutions covering everything from datavisualization to AI-powered data labeling andmore.
We organize all of the trending information in your field so you don't have to. Join 17,000+ users and stay up to date on the latest articles your peers are reading.
You know about us, now we want to get to know you!
Let's personalize your content
Let's get even more personalized
We recognize your account from another site in our network, please click 'Send Email' below to continue with verifying your account and setting a password.


Let's personalize your content