This site uses cookies to improve your experience. To help us insure we adhere to various privacy regulations, please select your country/region of residence. If you do not select a country, we will assume you are from the United States. Select your Cookie Settings or view our Privacy Policy and Terms of Use.
Cookie Settings
Cookies and similar technologies are used on this website for proper function of the website, for tracking performance analytics and for marketing purposes. We and some of our third-party providers may use cookie data for various purposes. Please review the cookie settings below and choose your preference.
Used for the proper function of the website
Used for monitoring website traffic and interactions
Cookie Settings
Cookies and similar technologies are used on this website for proper function of the website, for tracking performance analytics and for marketing purposes. We and some of our third-party providers may use cookie data for various purposes. Please review the cookie settings below and choose your preference.
Strictly Necessary: Used for the proper function of the website
Performance/Analytics: Used for monitoring website traffic and interactions
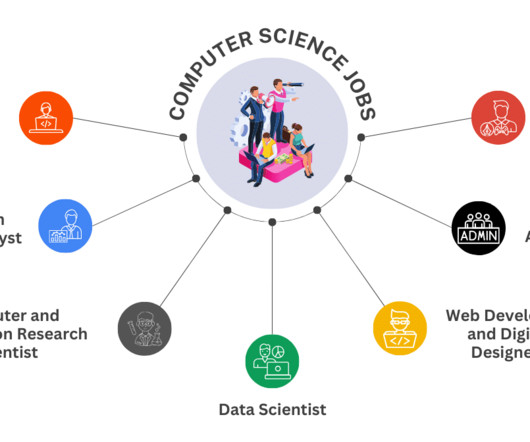
Data Analyst Data analysts are responsible for collecting, analyzing, and interpreting large sets of data to identify patterns and trends. They require strong analytical skills, knowledge of statistical analysis, and expertise in datavisualization.
Key Skills Required Knowledge of Algorithms and Predictive Models: Proficiency in using algorithms and predictive models to forecast future trends based on present data. DataVisualization Techniques: Ability to transform complex data into understandable graphs and charts.
They work closely with databaseadministrators to ensure data integrity, develop reporting tools, and conduct thorough analyses to inform business strategies. Their role is crucial in understanding the underlying data structures and how to leverage them for insights.
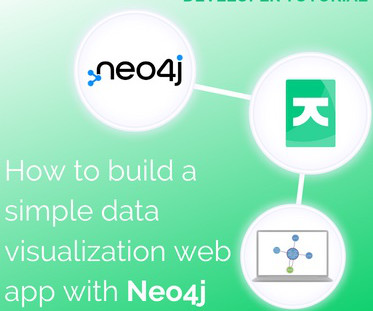
In this tutorial for JavaScript developers, I’ll demonstrate how to integrate our graph visualization SDKs with Neo4j to create a powerful datavisualization web app. The Neo4j resources I’ll use in this tutorial are: Neo4j AuraDB – Neo4j’s cloud graph database service.
It is popular for its powerful datavisualization and analysis capabilities. Hence, Data Scientists rely on R to perform complex statistical operations. With a wide array of packages like ggplot2 and dplyr, R allows for sophisticated datavisualization and efficient data manipulation. Wrapping it up !!!
DBT Activation Now that usable datasets have been created, the next step is to create BI Reports and DataVisualizations to analyze the data. We can also create advanced data science models with this data using AI/ Machine Learning. Click on the link above to learn more!
DatabaseAdministrator (DBA): They are responsible for managing and maintaining databases used by organizations to store and retrieve data. They ensure data security, optimize database performance, and troubleshoot any issues that arise. Why Pursue a Course in Data Science?
Technologies, tools, and methodologies Imagine Data Intelligence as a toolbox filled with gadgets for every analytical need. From powerful analytics software to Machine Learning algorithms, these tools transform data into actionable intelligence. 8,45000 Database management, programming (e.g.,
We organize all of the trending information in your field so you don't have to. Join 17,000+ users and stay up to date on the latest articles your peers are reading.
You know about us, now we want to get to know you!
Let's personalize your content
Let's get even more personalized
We recognize your account from another site in our network, please click 'Send Email' below to continue with verifying your account and setting a password.


Let's personalize your content