This site uses cookies to improve your experience. To help us insure we adhere to various privacy regulations, please select your country/region of residence. If you do not select a country, we will assume you are from the United States. Select your Cookie Settings or view our Privacy Policy and Terms of Use.
Cookie Settings
Cookies and similar technologies are used on this website for proper function of the website, for tracking performance analytics and for marketing purposes. We and some of our third-party providers may use cookie data for various purposes. Please review the cookie settings below and choose your preference.
Used for the proper function of the website
Used for monitoring website traffic and interactions
Cookie Settings
Cookies and similar technologies are used on this website for proper function of the website, for tracking performance analytics and for marketing purposes. We and some of our third-party providers may use cookie data for various purposes. Please review the cookie settings below and choose your preference.
Strictly Necessary: Used for the proper function of the website
Performance/Analytics: Used for monitoring website traffic and interactions
Any serious applications of LLMs require an understanding of nuances in how LLMs work, embeddings, vector databases, retrieval augmented generation (RAG), orchestration frameworks, and more. This talk will introduce you to the fundamentals of large language models and its emerging architectures.
This post looks at some of the open source datavisualization tools our customers tell us theyve tried before upgrading to our fully-supported toolkits for their analysis apps. Teams working on datavisualization applications always aim to build the best product they can. js) GraphViz Viz.js
In this tutorial for JavaScript developers, I’ll demonstrate how to integrate our graph visualization SDKs with Neo4j to create a powerful datavisualization web app. The Neo4j resources I’ll use in this tutorial are: Neo4j AuraDB – Neo4j’s cloud graph database service.
Visualizing graph data doesn’t necessarily depend on a graph database… Working on a graph visualization project? You might assume that graph databases are the way to go – they have the word “graph” in them, after all. Do I need a graph database? It depends on your project. Unstructured?
How do you measure the value of adding datavisualization to your web app? If you choose to build a visualization component using a datavisualization library, what is that investment worth? You’ll be able to justify whether or not datavisualization is a sound investment that’ll reap rewards.
Must-Use DataVisualization Datasets, AI Frameworks for Software Engineering, DynGAN, and 50% Off ODSC West 12 Must-Use Datasets for DataVisualization in 2024 Need to practice making sense of your data? Million by Dutch Watchdog for Illegal Facial Recognition Database Clearview AI, a U.S.-based
It’s a foundational skill for working with relational databases Just about every data scientist or analyst will have to work with relational databases in their careers. So by learning to use SQL, you’ll write efficient and effective queries, as well as understand how the data is structured and stored.
Chris had earned an undergraduate computer science degree from Simon Fraser University and had worked as a database-oriented software engineer. In 2004, Tableau got both an initial series A of venture funding and Tableau’s first EOM contract with the database company Hyperion—that’s when I was hired. Release v1.0
They are being increasingly challenged to improve efficiency and cost savings, embrace automation, and engage in data-driven decision making that helps their organization stand out from the competition. A business event can describe anything that happens which is significant to an enterprise’s operation.
The challenge to understand hidden relationships and uncover actionable insights from data is universal, across countless datavisualization use cases. In this blog post, we focus on seven of the most popular: Why visualizedata as a graph? Datavisualization makes it easy for us to identify trends and outliers.
To build a high-performance, scalable graph visualization application, you need a reliable way to store and query your data. Neo4j is one of the most popular graph database choices among our customers. In this blog post, I’ll outline three simple steps to create an interactive React Neo4j visualization tool.
This Azure Cosmos DB tutorial shows you how to integrate Microsoft’s multi-model database service with our graph and timeline visualization SDKs to build an interactive graph application. There’s support for MongoDB, PostgreSQL, Apache Cassandra, Apache Gremlin, and Tables, and our datavisualization toolkits work with all of them.
Chris had earned an undergraduate computer science degree from Simon Fraser University and had worked as a database-oriented software engineer. In 2004, Tableau got both an initial series A of venture funding and Tableau’s first OEM contract with the database company Hyperion—that’s when I was hired. Release v1.0
Improving your data literacy not only involves hard skills, such as programming languages, but soft skills such as interpersonal communication, and stakeholder relations, as well as blended skills such as datavisualization. SQL Databases might sound scary, but honestly, they’re not all that bad. Learning is learning.
As you’ll see below, however, a growing number of data analytics platforms, skills, and frameworks have altered the traditional view of what a data analyst is. Data Presentation: Communication Skills, DataVisualization Any good data analyst can go beyond just number crunching.
We’ve seen significant interest in TigerGraph’s fast, scalable graph database platform recently. In response, I put together this TigerGraph tutorial to create a React graph visualization application that integrates with their cloud database. Now we’ll create a database query that we can use in ReGraph.
Monday’s sessions will cover a wide range of topics, from Generative AI and LLMs to MLOps and DataVisualization. Tuesday is the first day of the AI Expo and Demo Hall , where you can connect with our conference partners and check out the latest developments and research from leading tech companies. What’s next?
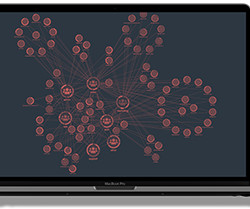
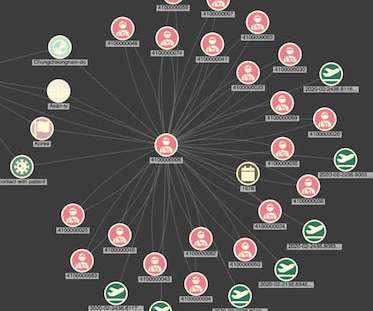
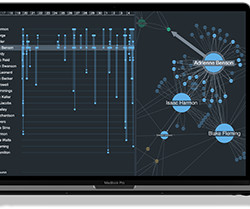
Using the KeyLines SDK for graph visualization and the KronoGraph SDK for time-based analytics , our application gives end users two powerful ways to visualize the same data and investigate fraud. Amazon Neptune graph datavisualized using KeyLines and KronoGraph Why visualize identity fraud?
Analysts rely on our datavisualization toolkits to spot hidden patterns in their visualizeddata. What role can interactive datavisualization play? If you’re ready to start visualizing your data on a map, sign up for a free trial. FREE: Start your KeyLines trial today Visualize your data!
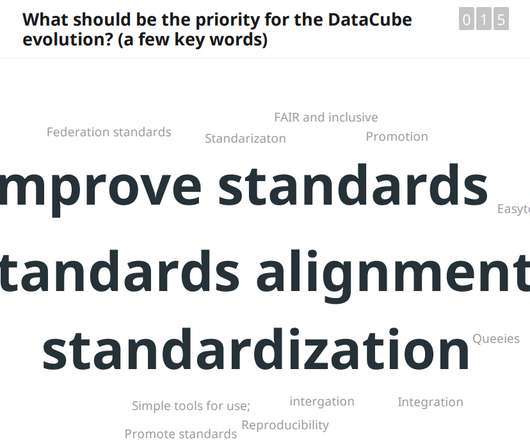
How can we all make environmental data more usable, accessible and more relevant? Presentations include demos of functionality and proposals for the future development work, primarily funded by the Horizon Europe programme. The safest option seems to be to create data cubes with or without CC-By-NC data included.
What are the Best Database Security Practices to Implement? Implementing these database security best practices can help keep your private data as secure as possible.
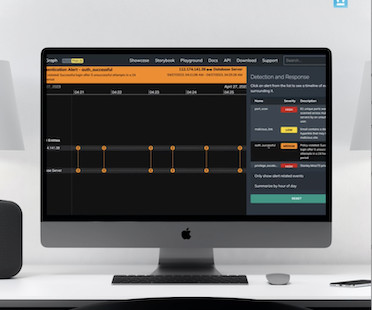
Many businesses use extended detection and response (XDR) to aggregate the threat data behind the constant breach warnings. But without interactive datavisualization , it doesn’t give them true insight – it just contributes to their information overload. FREE: Start your KronoGraph trial today Visualize your data!
Inference Speed Is the Key To Unleashing AI’s Potential Inference: Where AI Training Ends & Business Begins Industry, Opinion, Career Advice The Impact of DataVisualization Tools on Brand Strategy Development Charts, graphs, and maps are all useful tools that transform raw data into visually engaging formats.
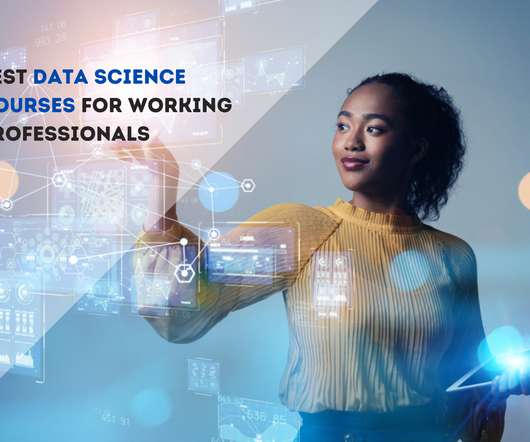
These include the following: Introduction to Data Science Introduction to Python SQL for Data Analysis Statistics DataVisualization with Tableau 5. Data Science Program for working professionals by Pickl.AI Another popular Data Science course for working professionals is offered by Pickl.AI.
Data science is used to protect people from dangers like harmful algal blooms and unsustainable fishing practices , and to monitor effects of a changing climate on natural disasters , financial inclusion , and wildlife conservation. An early demonstration of transformers was applied to detect hate speech in multimodal memes.
This comprehensive blog outlines vital aspects of Data Analyst interviews, offering insights into technical, behavioural, and industry-specific questions. It covers essential topics such as SQL queries, datavisualization, statistical analysis, machine learning concepts, and data manipulation techniques.
Many rely on graph technology and healthcare datavisualization for this because it’s powerful, it’s accessible, and its advanced algorithms help analysts to identify, investigate and predict fraud. Timeline visualization of AI data The AI also gives us time-based data. Request a free trial today.
🌵 ♬ use this audio if im the best editor oat – alpine Wolfram Alpha : Wolfram Alpha is a computational knowledge engine that can answer any question or query using its vast database of facts and algorithms. In essence, the AI model acts as a bridge between users, allowing them to communicate via chat and generate visuals.
The ultimate guide to graph visualization Everything you need to start designing your best graph visualization application. Download the guide With our datavisualization toolkits , you’re not restricted by your choice of technology: they’re compatible with every framework.
See my article on visualizing graph data without a graph database You can evaluate our tools for free. Just request a trial to start building your own interactive visualizations! FREE: Start your trial today Visualize your data! Request full access to our SDKs, demos and live-coding playgrounds.
We organize all of the trending information in your field so you don't have to. Join 17,000+ users and stay up to date on the latest articles your peers are reading.
You know about us, now we want to get to know you!
Let's personalize your content
Let's get even more personalized
We recognize your account from another site in our network, please click 'Send Email' below to continue with verifying your account and setting a password.


Let's personalize your content