This site uses cookies to improve your experience. To help us insure we adhere to various privacy regulations, please select your country/region of residence. If you do not select a country, we will assume you are from the United States. Select your Cookie Settings or view our Privacy Policy and Terms of Use.
Cookie Settings
Cookies and similar technologies are used on this website for proper function of the website, for tracking performance analytics and for marketing purposes. We and some of our third-party providers may use cookie data for various purposes. Please review the cookie settings below and choose your preference.
Used for the proper function of the website
Used for monitoring website traffic and interactions
Cookie Settings
Cookies and similar technologies are used on this website for proper function of the website, for tracking performance analytics and for marketing purposes. We and some of our third-party providers may use cookie data for various purposes. Please review the cookie settings below and choose your preference.
Strictly Necessary: Used for the proper function of the website
Performance/Analytics: Used for monitoring website traffic and interactions
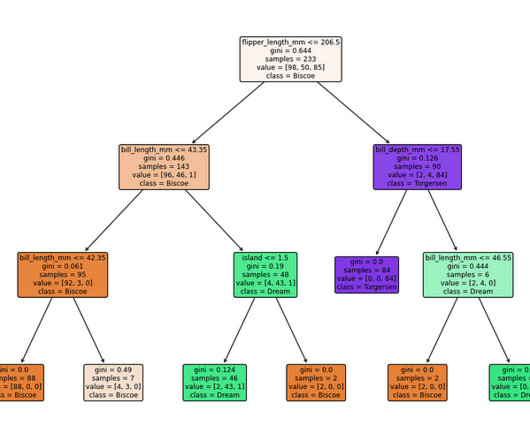
Fall in Love with DecisionTrees with dtreeviz’s Visualization This member-only story is on us. DecisionTrees, also known as CART (Classification and Regression Trees), are undoubtedly one of the most intuitive algorithms in the machine learning space, thanks to their simplicity. Why am I saying this?
Entropy: These plots are critical in the field of decisiontrees and ensemble learning. They depict the impurity measures at different decision points. Suppose you’re building a decisiontree to classify customer feedback as positive or negative. The choice between the two depends on the specific use case.
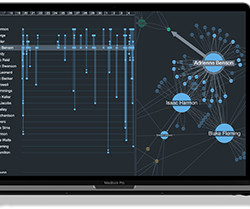
Algorithms: Decisiontrees, random forests, logistic regression, and more are like different techniques a detective might use to solve a case. DataVisualization Think of datavisualization as creating a visual map of the data.
Data analysis and interpretation After mining, the results are utilized for analytical modeling. Datavisualization plays an important role in this stage, as it helps stakeholders interpret findings clearly and effectively communicate insights through compelling storytelling.
You're not ready for neural networks if you cant explain Linear Regression or DecisionTrees. Lets get started. Forget deep learning for now. Its crucial to start with small, simple models. These simple models work wonders for small datasets and lay a solid foundation for understanding the basics.
You're not ready for neural networks if you cant explain Linear Regression or DecisionTrees. Lets get started. Forget deep learning for now. Its crucial to start with small, simple models. These simple models work wonders for small datasets and lay a solid foundation for understanding the basics.
Algorithms: Decisiontrees, random forests, logistic regression, and more are like different techniques a detective might use to solve a case. DataVisualization Think of datavisualization as creating a visual map of the data.
Data Science Dojo Data Science Bootcamp Delivery Format : Online and In-person Tuition : $4,500 Duration : 16 weeks Data Science Dojo Bootcamp Data Science Dojo Bootcamp is a great option for students who want to learn data science skills without breaking the bank.
Machine learning algorithms Machine learning forms the core of Applied Data Science. It leverages algorithms to parse data, learn from it, and make predictions or decisions without being explicitly programmed.
Summary: Data Analysis focuses on extracting meaningful insights from raw data using statistical and analytical methods, while datavisualization transforms these insights into visual formats like graphs and charts for better comprehension. Deep Dive: What is DataVisualization?
However, presenting data is a crucial exercise that requires a lot of creativity to ensure that every team member can grasp the meaning of the content. Many people get confused about how to find valuable insights from a large volume of data in a spreadsheet. That’s […].
Explore unique dataset for your upcoming data science project ? Submission Suggestions Predicting the Protein Structure Resolution Using DecisionTree was originally published in MLearning.ai Medium’s Boost / New Multimodal Models / 180K+ AI Art Prompts Mlearning.ai
Introduction to Random Forest What’s the first image that comes to your mind when you think about Random Forest? It conjures up images of. The post A Beginner’s Guide to Random Forest Hyperparameter Tuning appeared first on Analytics Vidhya.
The post Plotting Decision Surface for Classification Machine Learning Algorithms appeared first on Analytics Vidhya. Overview Machine Learning algorithms for classification involve learning how to assign classes to observations. There are nuances to every algorithm. Each algorithm differs in.
It involves developing algorithms that can learn from and make predictions or decisions based on data. Familiarity with regression techniques, decisiontrees, clustering, neural networks, and other data-driven problem-solving methods is vital. This is where datavisualization comes in.
A machine learning decisiontree can help data science professionals prevent synthetic identity theft. Whether they track individuals’ credit scores, loan activity, or purchasing patterns, the background of historical data will make outliers stand out. Another useful detection tool is datavisualization.
You're not ready for neural networks if you cant explain Linear Regression or DecisionTrees. Lets get started. Forget deep learning for now. Its crucial to start with small, simple models. These simple models work wonders for small datasets and lay a solid foundation for understanding the basics.
Hopefully, this article will serve as a roadmap for leveraging the power of R, a versatile programming language, for spatial analysis, data science and visualization within GIS contexts. Numerous spatial data formats, including shapefiles, GeoJSON, GeoTIFF, and NetCDF, can be read and written by these programs.
Naïve Bayes algorithms include decisiontrees , which can actually accommodate both regression and classification algorithms. Random forest algorithms —predict a value or category by combining the results from a number of decisiontrees.
Aspiring Data Scientists must equip themselves with a diverse skill set encompassing technical expertise, analytical prowess, and domain knowledge. Whether you’re venturing into machine learning, predictive analytics, or datavisualization, honing the following top Data Science skills is essential for success.
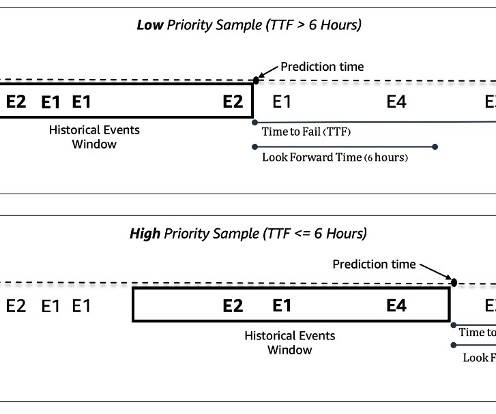
If your data exhibits seasonal patterns (e.g., Data Exploration and Visualization Explore the data to understand its characteristics. Use datavisualization tools (histograms, scatter plots) to identify patterns, trends, and potential relationships between variables.
Matplotlib The main benefit of Matplotlib is its stunning visualizations. Programmers most frequently utilize Matplotlib for datavisualization projects. The datavisualization market could reach approximately $7.76 It’s a plotting library with a vibrant community of around 700 contributors. Not a bad list right?
Various ML algorithms can be employed for network traffic analysis, depending on the specific objectives and data characteristics. It can ingest, process, and analyze large volumes of network data, making it suitable for organizations dealing with extensive traffic.
FREE: Managing fraud The ultimate guide to fraud detection, investigation and prevention using datavisualization GET YOUR FREE GUIDE The role of new & existing technology For many years, credit card companies have relied on analytics, algorithms and decisiontrees to power their fraud strategy.
Using sophisticated datavisualization tools, many of which are powered by AI, app analytics services empower businesses to better understand IT operations , helping teams make smarter decisions, faster. AI in SaaS analytics Most industries have had to reckon with AI proliferation and AI-driven business practices to some extent.
DataVisualization Presenting data in a comprehensible manner is an art. Data Scientists should be adept at creating datavisualizations that tell a compelling story. Communication Skills Data Scientists need to translate their findings into actionable recommendations for non-technical stakeholders. .
Simple chatbots without generative AI integration rely on pre-programmed responses and rule-based decisiontrees to guide their interactions with users. Services : AI Solution Development, ML Engineering, Data Science Consulting, NLP, AI Model Development, AI Strategic Consulting, Computer Vision.
Automation not only saves time but also enhances accuracy and consistency by minimizing manual intervention, thereby contributing to more reliable insights and better decision-making. From linear regression to decisiontrees, Alteryx provides robust statistical models for forecasting trends and making informed decisions.
It is popular for its powerful datavisualization and analysis capabilities. Hence, Data Scientists rely on R to perform complex statistical operations. With a wide array of packages like ggplot2 and dplyr, R allows for sophisticated datavisualization and efficient data manipulation. Wrapping it up !!!
Because these techniques are making assumptions about the data being input, it is possible for them to incorrectly label anomalies. “Means,” or average data, refers to the points in the center of the cluster that all other data is related to.
The fields have evolved such that to work as a data analyst who views, manages and accesses data, you need to know Structured Query Language (SQL) as well as math, statistics, datavisualization (to present the results to stakeholders) and data mining.
It’s a cloud-based platform that provides datavisualization, collaboration tools, and advanced tracking and reporting ( Comet-ML , 2023). The platform’s goal is to make machine learning more accessible and efficient for researchers, data scientists, and machine learning practitioners.
DecisionTrees ML-based decisiontrees are used to classify items (products) in the database. This is the applied machine learning algorithm that works with tabular and structured data. In its core, lie gradient-boosted decisiontrees. Datavisualization charts and plot graphs can be used for this.
Once the exploratory steps are completed, the cleansed data is subjected to various algorithms like predictive analysis, regression, text mining, recognition patterns, etc depending on the requirements. In the final stage, the results are communicated to the business in a visually appealing manner. character) is underlined or not.
AutoGluon is easy-to-use AutoML tool that uses automatic data processing, hyperparameter tuning, and model ensemble. The best baseline was achieved with a weighted ensemble of gradient boosted decisiontree models. Raj Salvaji leads Solutions Architecture in the Hospitality segment at AWS.
Here is the tabular representation of the same: Technical Skills Non-technical Skills Programming Languages: Python, SQL, R Good written and oral communication Data Analysis: Pandas, Matplotlib, Numpy, Seaborn Ability to work in a team ML Algorithms: Regression Classification, DecisionTrees, Regression Analysis Problem-solving capability Big Data: (..)
DataVisualizationData scientists may be expected to know some basic datavisualization to help tell a story with their data and algorithms. Luckily, nothing too complicated is needed, as Tableau is user-friendly while matplotlib is the popular Python library for datavisualization.
Data Analysis Data analysis is the heart of deriving insights from the gathered information. DataVisualizationDatavisualization transforms complex data sets into intuitive and visually appealing representations. Graphs, charts, and infographics aid in conveying information effectively.
Key topics include: Supervised Learning Understanding algorithms such as linear regression, decisiontrees, and support vector machines, and their applications in Big Data. Understanding how to assess model performance is crucial for data scientists.
Packages like stats, car, and survival are commonly used for statistical modeling and analysis. · DataVisualization : R offers several libraries, including ggplot2, plotly, and lattice, that allow for the creation of high-quality visualizations. Suppose you want to develop a classification model to predict customer churn.
This comprehensive blog outlines vital aspects of Data Analyst interviews, offering insights into technical, behavioural, and industry-specific questions. It covers essential topics such as SQL queries, datavisualization, statistical analysis, machine learning concepts, and data manipulation techniques.
Visualising data makes it easier to identify anomalies and understand distributions. More to read: How is DataVisualization helpful in Business Analytics? It’s critical in harnessing data insights for decision-making, empowering businesses with accurate forecasts and actionable intelligence.
Dive Deep into Machine Learning and AI Technologies Study core Machine Learning concepts, including algorithms like linear regression and decisiontrees. Understanding real-time data processing frameworks, such as Apache Kafka, will also enhance your ability to handle dynamic analytics.
It’s also much more difficult to see how the intricate network of neurons processes the input data than to comprehend, say, a decisiontree. From our human perspective, the price we pay is that deep learning models are much larger than traditional ML models.
We organize all of the trending information in your field so you don't have to. Join 17,000+ users and stay up to date on the latest articles your peers are reading.
You know about us, now we want to get to know you!
Let's personalize your content
Let's get even more personalized
We recognize your account from another site in our network, please click 'Send Email' below to continue with verifying your account and setting a password.


Let's personalize your content