This site uses cookies to improve your experience. To help us insure we adhere to various privacy regulations, please select your country/region of residence. If you do not select a country, we will assume you are from the United States. Select your Cookie Settings or view our Privacy Policy and Terms of Use.
Cookie Settings
Cookies and similar technologies are used on this website for proper function of the website, for tracking performance analytics and for marketing purposes. We and some of our third-party providers may use cookie data for various purposes. Please review the cookie settings below and choose your preference.
Used for the proper function of the website
Used for monitoring website traffic and interactions
Cookie Settings
Cookies and similar technologies are used on this website for proper function of the website, for tracking performance analytics and for marketing purposes. We and some of our third-party providers may use cookie data for various purposes. Please review the cookie settings below and choose your preference.
Strictly Necessary: Used for the proper function of the website
Performance/Analytics: Used for monitoring website traffic and interactions
Cluster visualization Using t-SNE for exploratorydataanalysis allows researchers to visualize clusters in unlabeled data effectively, facilitating deeper insights into data organization.
Making visualizations is one of the finest ways for data scientists to explain dataanalysis to people outside the business. Exploratorydataanalysis can help you comprehend your data better, which can aid in future data preprocessing. ExploratoryDataAnalysis What is EDA?
In this practical Kaggle notebook, I went through the basic techniques to work with time-series data, starting from data manipulation, analysis, and visualization to understand your data and prepare it for and then using statistical, machine, and deeplearning techniques for forecasting and classification.
Basic knowledge of statistics is essential for data science. Statistics is broadly categorized into two types – Descriptive statistics – Descriptive statistics is describing the data. Visual graphs are the core of descriptive statistics. ExploratoryDataAnalysis. DeepLearning.
They employ statistical and mathematical techniques to uncover patterns, trends, and relationships within the data. Data scientists possess a deep understanding of statistical modeling, datavisualization, and exploratorydataanalysis to derive actionable insights and drive business decisions.
1, Data is the new oil, but labeled data might be closer to it Even though we have been in the 3rd AI boom and machine learning is showing concrete effectiveness at a commercial level, after the first two AI booms we are facing a problem: lack of labeled data or data themselves.
Some machine learning packages focus specifically on deeplearning, which is a subset of machine learning that deals with neural networks and complex, hierarchical representations of data. Let’s explore some of the best Python machine learning packages and understand their features and applications.
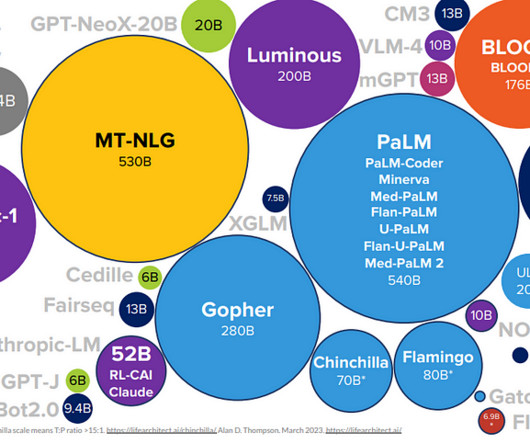
It wasn’t until the development of deeplearning algorithms in the 2000s and 2010s that LLMs truly began to take shape. Deeplearning algorithms are designed to mimic the structure and function of the human brain, allowing them to process vast amounts of data and learn from that data over time.
Image recognition is one of the most relevant areas of machine learning. Deeplearning makes the process efficient. However, not everyone has deeplearning skills or budget resources to spend on GPUs before demonstrating any value to the business. DataRobot Visual AI. Submit Data. Run Autopilot.
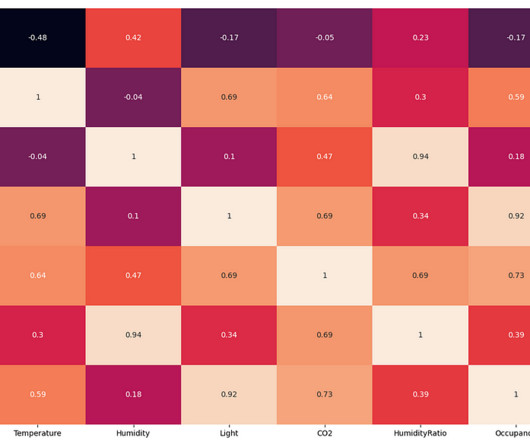
The exploratorydataanalysis found that the change in room temperature, CO levels, and light intensity can be used to predict the occupancy of the room in place of humidity and humidity ratio. We will also be looking at the correlation between the variables. We pay our contributors, and we don't sell ads.
Data science equips you with the tools and techniques to manage big data, perform exploratorydataanalysis, and extract meaningful information from complex datasets. Making data-driven decisions: Data science empowers you to make informed decisions by analyzing and interpreting data.
Proficient in programming languages like Python or R, data manipulation libraries like Pandas, and machine learning frameworks like TensorFlow and Scikit-learn, data scientists uncover patterns and trends through statistical analysis and datavisualization. Big Data Technologies: Hadoop, Spark, etc.
I will start by looking at the data distribution, followed by the relationship between the target variable and independent variables. Editor's Note: Heartbeat is a contributor-driven online publication and community dedicated to providing premier educational resources for data science, machine learning, and deeplearning practitioners.
This comprehensive blog outlines vital aspects of Data Analyst interviews, offering insights into technical, behavioural, and industry-specific questions. It covers essential topics such as SQL queries, datavisualization, statistical analysis, machine learning concepts, and data manipulation techniques.
It can be applied to a wide range of domains and has numerous practical applications , such as customer segmentation, image and document categorization, anomaly detection, and social network analysis. Encoding should be performed carefully to avoid introducing bias or misinterpretation of the data.
It is a powerful tool that illuminates patterns, trends, and anomalies, enabling data scientists and stakeholders to make informed decisions. DataVisualization unveils data characteristics, distributions, and relationships, guiding feature engineering and preprocessing.
Descriptive Analytics Projects: These projects focus on summarizing historical data to gain insights into past trends and patterns. Examples include generating reports, dashboards, and datavisualizations to understand business performance, customer behavior, or operational efficiency. ImageNet).
These include the following: Introduction to Data Science Introduction to Python SQL for DataAnalysis Statistics DataVisualization with Tableau 5. Data Science Program for working professionals by Pickl.AI Another popular Data Science course for working professionals is offered by Pickl.AI.
We organize all of the trending information in your field so you don't have to. Join 17,000+ users and stay up to date on the latest articles your peers are reading.
You know about us, now we want to get to know you!
Let's personalize your content
Let's get even more personalized
We recognize your account from another site in our network, please click 'Send Email' below to continue with verifying your account and setting a password.


Let's personalize your content