This site uses cookies to improve your experience. To help us insure we adhere to various privacy regulations, please select your country/region of residence. If you do not select a country, we will assume you are from the United States. Select your Cookie Settings or view our Privacy Policy and Terms of Use.
Cookie Settings
Cookies and similar technologies are used on this website for proper function of the website, for tracking performance analytics and for marketing purposes. We and some of our third-party providers may use cookie data for various purposes. Please review the cookie settings below and choose your preference.
Used for the proper function of the website
Used for monitoring website traffic and interactions
Cookie Settings
Cookies and similar technologies are used on this website for proper function of the website, for tracking performance analytics and for marketing purposes. We and some of our third-party providers may use cookie data for various purposes. Please review the cookie settings below and choose your preference.
Strictly Necessary: Used for the proper function of the website
Performance/Analytics: Used for monitoring website traffic and interactions
Technical Fellow, Tableau. Innovation is necessary to use data effectively in the pursuit of a better world, particularly because data continues to increase in size and richness. I am proud to announce that my History of Tableau Innovation viz is now published to Tableau Public. Jock Mackinlay. Bronwen Boyd.
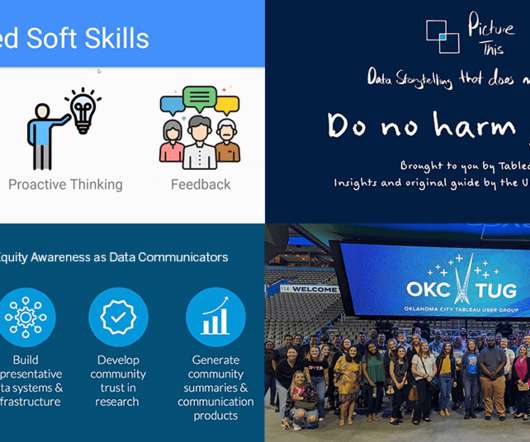
Tableau Academic Programs Instructional Designer. Bridge the data literacy gap for students in academia. Working with data is a necessity for most jobs, and analytical skills can be a huge differentiator for success across all kinds of work—whether corporate, nonprofit, or academic. Learning how to communicate with data .
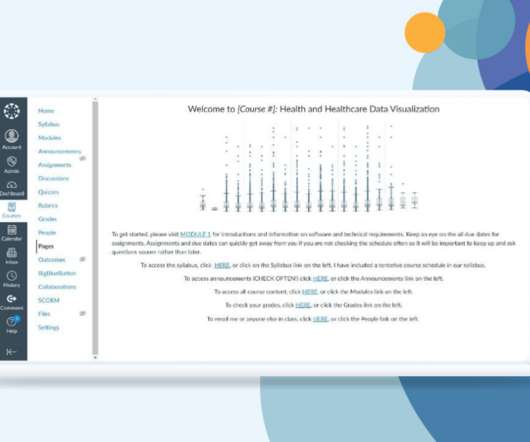
Curriculum Development Manager, Tableau. I’m proud to announce that our ready-made Data Literacy One curriculum is now available in Canvas learning management system (LMS) format. Plus, academic institutions have an opportunity to address the growing data literacy gap. Sue Kraemer. Kristin Adderson. September 2, 2021 - 1:50pm.
Curriculum Development Manager, Tableau. I’m proud to announce that our ready-made Data Literacy One curriculum is now available in Canvas learning management system (LMS) format. Plus, academic institutions have an opportunity to address the growing data literacy gap. Sue Kraemer. Kristin Adderson. September 2, 2021 - 1:50pm.
Explore the top 10 machine learning demos and discover cutting-edge techniques that will take your skills to the next level. Case studies highlighting its effectiveness Scikit-learn has been used in a variety of successful data analysis projects. It has a wide range of datavisualization tools.
Senior Vice President, Product Marketing, Tableau. Every company today is being asked to do more with less, and leaders need access to fresh, trusted KPIs and data-driven insights to manage their businesses, keep ahead of the competition, and provide unparalleled customer experiences. . All your customer data is instantly accessible.
Senior Vice President, Product Marketing, Tableau. Every company today is being asked to do more with less, and leaders need access to fresh, trusted KPIs and data-driven insights to manage their businesses, keep ahead of the competition, and provide unparalleled customer experiences. . All your customer data is instantly accessible.
Technical Fellow, Tableau. Innovation is necessary to use data effectively in the pursuit of a better world, particularly because data continues to increase in size and richness. I am proud to announce that my History of Tableau Innovation viz is now published to Tableau Public. Jock Mackinlay. Bronwen Boyd.
Senior Data Skills Curriculum Strategy Manager, Tableau. According to the National Institutes of Health (NIH), “Datavisualization is becoming an increasingly common method of presenting large and complex data sets, but the principles of visual communication are not widely understood or practiced.”
Senior Data Skills Curriculum Strategy Manager, Tableau. According to the National Institutes of Health (NIH), “Datavisualization is becoming an increasingly common method of presenting large and complex data sets, but the principles of visual communication are not widely understood or practiced.”
Welcome to the Tableau User Group Monthly, where you can find a curated list of highlights and content from a month of User Group events all over the globe. What are Tableau User Groups? Tableau User Groups (TUGs) are inclusive meetup events for Tableau enthusiasts to connect, learn and discuss all things Tableau.
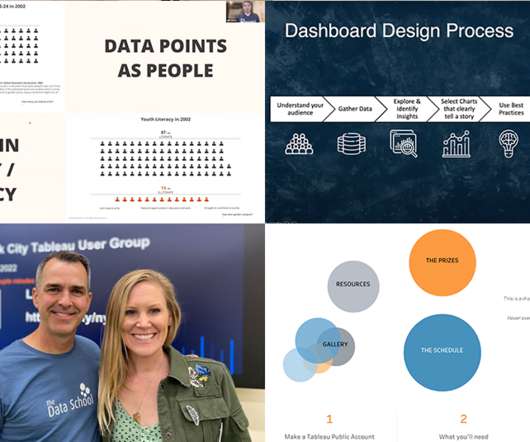
Welcome to the Tableau User Group Monthly where you can find a curated list of highlights and content from a month of User Group events all over the globe. Tableau Community Members Laura Sandford, Pablo Gomez, Irene Diomi, Will Sutton, Priya Padham, Sarah Bartlett and David Pires at a London Tableau User Group meetup.
Welcome to the Tableau User Group Monthly where you can find a curated list of highlights and content from a month of User Group events all over the globe. Tableau Community Members Laura Sandford, Pablo Gomez, Irene Diomi, Will Sutton, Priya Padham, Sarah Bartlett and David Pires at a London Tableau User Group meetup.
Tableau Academic Programs Instructional Designer. Bridge the data literacy gap for students in academia. Working with data is a necessity for most jobs, and analytical skills can be a huge differentiator for success across all kinds of work—whether corporate, nonprofit, or academic. Learning how to communicate with data .
Allison (Ally) Witherspoon Johnston Senior Vice President, Product Marketing, Tableau Bronwen Boyd December 7, 2022 - 11:16pm February 14, 2023 In the quest to become a customer-focused company, the ability to quickly act on insights and deliver personalized customer experiences has never been more important. Up to date. Let’s explore how.
In this article we will walk through a demo of the PyGWalker package in Python. For this we will use NBA stats from the below web page: Continue reading on MLearning.ai »
This allows for it to be integrated with many different tools and technologies to improve data management and analysis workflows. One set of tools that are becoming more important in our data-driven world is BI tools. Think of Tableau, Power BI, and QlikView.
As you’ll see below, however, a growing number of data analytics platforms, skills, and frameworks have altered the traditional view of what a data analyst is. Data Presentation: Communication Skills, DataVisualization Any good data analyst can go beyond just number crunching.
These include the following: Introduction to Data Science Introduction to Python SQL for Data Analysis Statistics DataVisualization with Tableau 5. Data Science Program for working professionals by Pickl.AI Another popular Data Science course for working professionals is offered by Pickl.AI.
This comprehensive blog outlines vital aspects of Data Analyst interviews, offering insights into technical, behavioural, and industry-specific questions. It covers essential topics such as SQL queries, datavisualization, statistical analysis, machine learning concepts, and data manipulation techniques.
We organize all of the trending information in your field so you don't have to. Join 17,000+ users and stay up to date on the latest articles your peers are reading.
You know about us, now we want to get to know you!
Let's personalize your content
Let's get even more personalized
We recognize your account from another site in our network, please click 'Send Email' below to continue with verifying your account and setting a password.


Let's personalize your content