This site uses cookies to improve your experience. To help us insure we adhere to various privacy regulations, please select your country/region of residence. If you do not select a country, we will assume you are from the United States. Select your Cookie Settings or view our Privacy Policy and Terms of Use.
Cookie Settings
Cookies and similar technologies are used on this website for proper function of the website, for tracking performance analytics and for marketing purposes. We and some of our third-party providers may use cookie data for various purposes. Please review the cookie settings below and choose your preference.
Used for the proper function of the website
Used for monitoring website traffic and interactions
Cookie Settings
Cookies and similar technologies are used on this website for proper function of the website, for tracking performance analytics and for marketing purposes. We and some of our third-party providers may use cookie data for various purposes. Please review the cookie settings below and choose your preference.
Strictly Necessary: Used for the proper function of the website
Performance/Analytics: Used for monitoring website traffic and interactions
National Solutions Engineer, Tableau. Fresh off of Tableau Conference , we are back with the Best of the Tableau Web! Like many of you, I have always found great inspiration in Tableau Conference—from the conference sessions to the excitement of attendees and the burst of new, creative content from the DataFam.
Sarah Molina Corporate Marketing Analyst Sarah Molina February 1, 2023 - 9:50pm February 4, 2023 Tableau Public is a free online visual analytics platform that allows you to learn and practice data skills, create and explore datavisualizations, discover data stories, and create your own portfolio of work to share with your network.
National Solutions Engineer, Tableau. Fresh off of Tableau Conference , we are back with the Best of the Tableau Web! Like many of you, I have always found great inspiration in Tableau Conference—from the conference sessions to the excitement of attendees and the burst of new, creative content from the DataFam.
Editor's note: This article originally appeared in Tableau Public. When you want to explore, create, and share datavisualizations, we're happy to share that you can start creating vizzes directly from a browser on Tableau Public with the web authoring beta. If you don’t have a Tableau Public profile, create one for free.
Think your customers will pay more for datavisualizations in your application? But today, dashboards and visualizations have become table stakes. Five years ago they may have. Discover which features will differentiate your application and maximize the ROI of your embedded analytics. Brought to you by Logi Analytics.
Welcome to my first edition of Best of the Tableau Web (BOTW), where I’ll recap highlights from last month. For me, the Tableau Community has been a treasure trove of content that’s both highly inspirational and technically deep. In fact, the first piece of Tableau content that I found online in 2012 was the first edition of BOTW.
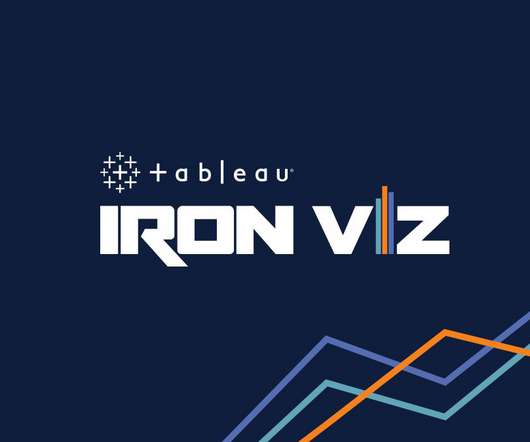
Marketing Manager, Community Content & Events, Tableau. The ultimate data showdown is back. We are calling on data rockstars (that’s you) from around the world to compete in our annual Iron Viz competition. Take your data skills to the next level. Build your Tableau Public portfolio. Visualizing the arts.
Senior Manager, Community Programs & Engagement at Tableau. The ultimate data showdown is back. Data rockstars (like you!) Earn the humble-bragging rights that come with qualifying for the world’s largest datavisualization contest. . So, Data Fam, what brings you joy? Andrew Grinaker. Ateken Abla.
Academic Program Senior Specialist, Tableau. Since 2011, Tableau Academic programs have enabled more than 2.5 million students and teachers from accredited institutions around the world with critical data skills. Tableau Desktop, Tableau Prep, and eLearning are free for all full-time students around the world.
Academic Program Specialist, Tableau. Since 2011, Tableau Academic programs have enabled more than 2.5 million students and teachers from accredited institutions around the world with critical data skills. Tableau Desktop, Tableau Prep , and eLearning are free for all full-time students around the world.
Marketing Manager, Community Content & Events, Tableau. The ultimate data showdown is back. We are calling on data rockstars (that’s you) from around the world to compete in our annual Iron Viz competition. Take your data skills to the next level. Build your Tableau Public portfolio. Visualizing the arts.
Sarah Molina Corporate Marketing Analyst Sarah Molina February 1, 2023 - 9:50pm February 4, 2023 Tableau Public is a free online visual analytics platform that allows you to learn and practice data skills, create and explore datavisualizations, discover data stories, and create your own portfolio of work to share with your network.
Director, Community Programs & Engagement at Tableau. While there is no single way to accelerate your data skills, all roads lead through the Tableau Community. Within the Community, you’ll find a collection of resources and activities designed to further your data journey and connect you with like-minded people. .
Director, Community Programs & Engagement at Tableau. While there is no single way to accelerate your data skills, all roads lead through the Tableau Community. Within the Community, you’ll find a collection of resources and activities designed to further your data journey and connect you with like-minded people. .
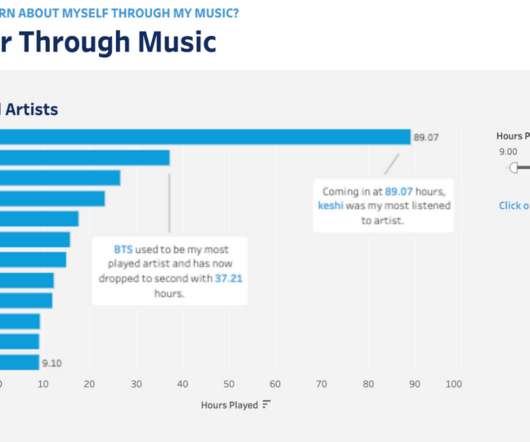
You don’t have to wait for your music streaming service to provide that for you anymore—you can see and learn from your listening data at any point in the year using Tableau. Whether this is your first Tableauvisualization or your 100th, let this be a chance to practice and grow your viz-building skills using your own personal data!
Download the pdf version, check out GitHub, and visit the code in Colab. These books can provide valuable insights and knowledge for a data scientist's professional development.2. Datavisualization tool: A data scientist often deals with large datasets and needs to present their findings effectively.
Welcome to my first edition of Best of the Tableau Web (BOTW), where I’ll recap highlights from last month. For me, the Tableau Community has been a treasure trove of content that’s both highly inspirational and technically deep. In fact, the first piece of Tableau content that I found online in 2012 was the first edition of BOTW.
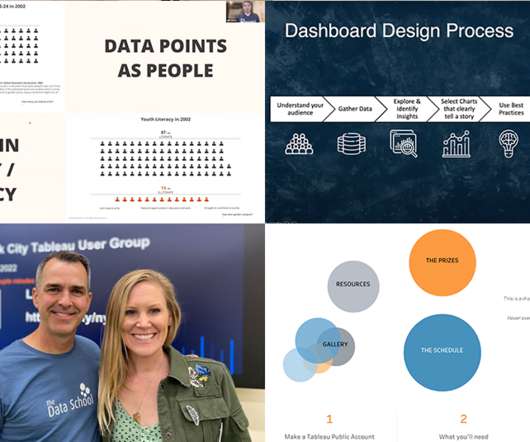
Welcome to the Tableau User Group Monthly where you can find a curated list of highlights and content from a month of User Group events all over the globe. Tableau Community Members Laura Sandford, Pablo Gomez, Irene Diomi, Will Sutton, Priya Padham, Sarah Bartlett and David Pires at a London Tableau User Group meetup.
Welcome to the Tableau User Group Monthly where you can find a curated list of highlights and content from a month of User Group events all over the globe. Tableau Community Members Laura Sandford, Pablo Gomez, Irene Diomi, Will Sutton, Priya Padham, Sarah Bartlett and David Pires at a London Tableau User Group meetup.
You don’t have to wait for your music streaming service to provide that for you anymore—you can see and learn from your listening data at any point in the year using Tableau. Whether this is your first Tableauvisualization or your 100th, let this be a chance to practice and grow your viz-building skills using your own personal data!
Editor's note: This article originally appeared in Tableau Public. When you want to explore, create, and share datavisualizations, we're happy to share that you can start creating vizzes directly from a browser on Tableau Public with the web authoring beta. If you don’t have a Tableau Public profile, create one for free.
Global Head of the Tableau Foundation. That is precisely what a trio of our Tableau Foundation partners are doing—driving local conversations about climate change. In 2016, Headwaters Economics began partnering with Tableau Foundation to build their data capacity to identify and solve problems related to the use of natural resources.
Global Head of the Tableau Foundation. That is precisely what a trio of our Tableau Foundation partners are doing—driving local conversations about climate change. In 2016, Headwaters Economics began partnering with Tableau Foundation to build their data capacity to identify and solve problems related to the use of natural resources.
One of the biggest benefits of Tableau is that the software is free and extremely versatile. It can connect any data source, although the better your source, the better the results will be. The software is easy to use and provides the ability to download different file formats.
Senior Manager Inclusive Marketing, Tableau. Can you picture a world where data storytelling does no harm? The Tableau Foundation has collaborated with The Urban Institute to bring to you the Do No Harm Guide : Applying Equity Awareness in DataVisualization. SENIOR DATA SCIENTIST, NATERA. Kristin Adderson.
While I created the visuals mainly in Jupyter Notebook using Matplotlib and Seaborn for direct analysis and its flexibility, in this part of the blog I also use images generated by Tableau for a polished and reader-friendly presentation. Therefore, below is the monthly average price of HDB flats from January 2017 to August 2023.
Senior Manager, Community Programs & Engagement at Tableau. The ultimate data showdown is back. Data rockstars (like you!) Earn the humble-bragging rights that come with qualifying for the world’s largest datavisualization contest. . So, Data Fam, what brings you joy? Andrew Grinaker. Ateken Abla.
To influence change and advance the understanding of what it means to use data with empathy and fairness, the Urban Institute, in partnership with Tableau Foundation , created the “ Do No Harm Guide: Applying Equity Awareness in DataVisualization. Urban Institute, recreated from Tableau dashboard].
To influence change and advance the understanding of what it means to use data with empathy and fairness, the Urban Institute, in partnership with Tableau Foundation , created the “ Do No Harm Guide: Applying Equity Awareness in DataVisualization. Urban Institute, recreated from Tableau dashboard].
Director, Community Programs & Engagement at Tableau. We are just weeks away from Tableau Conference and the ultimate visualization showdown —Iron Viz 2021—where three fierce contestants will take the virtual stage for an intense lightning round of live viz-tastic storytelling. . Andrew Grinaker. Ateken Abla. October 21, 2021.
Director, Community Programs & Engagement at Tableau. We are just weeks away from Tableau Conference and the ultimate visualization showdown —Iron Viz 2021—where three fierce contestants will take the virtual stage for an intense lightning round of live viz-tastic storytelling. . Andrew Grinaker. Ateken Abla. October 21, 2021.
When you download KNIME Analytics Platform for the first time, you will no doubt notice the sheer number of nodes available to use in your workflows. This is where KNIME truly shines and sets itself apart from its competitors: the scores of free extensions available for download.
Senior Manager Inclusive Marketing, Tableau. Can you picture a world where data storytelling does no harm? The Tableau Foundation has collaborated with The Urban Institute to bring to you the Do No Harm Guide : Applying Equity Awareness in DataVisualization. SENIOR DATA SCIENTIST, NATERA. Kristin Adderson.
Two of the platforms that we see emerging as a popular combination of data warehousing and business intelligence are the Snowflake Data Cloud and Power BI. Just click this button and fill out the form to download it. Want to Save This Guide for Later? No problem! Table of Contents Why Discuss Snowflake & Power BI?
Data Cleaning is a crucial step in any data analysis process, and it’s important to showcase your ability to handle messy data effectively. DataVisualization: Create compelling and informative DataVisualizations. Visual Appeal: Use clean and visually appealing DataVisualizations.
We recently connected with three data experts at the U.S. Census Bureau who are using Tableau to visualize race and ethnicity data from the 2020 Decennial Census. Tableau: What were your primary goals in creating the new race and ethnicity dashboards? The answer: datavisualizations.
We recently connected with three data experts at the U.S. Census Bureau who are using Tableau to visualize race and ethnicity data from the 2020 Decennial Census. Tableau: What were your primary goals in creating the new race and ethnicity dashboards? The answer: datavisualizations.
it has to be done using custom SQL in Tableau? Hopefully, you don’t run into this scenario because joining and querying multiple tables in Tableau using custom SQL is not recommended due to its impact on performance. These strategies will range from ways to reduce the size of your data, to your query structure.
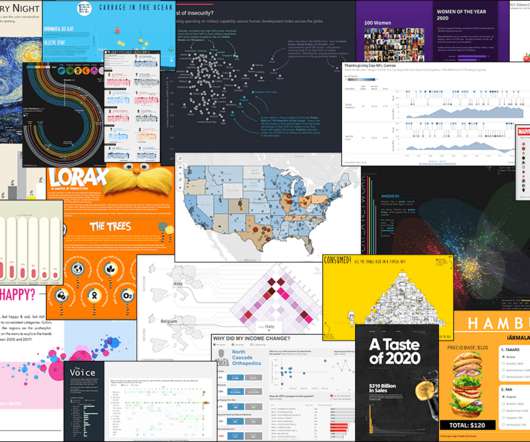
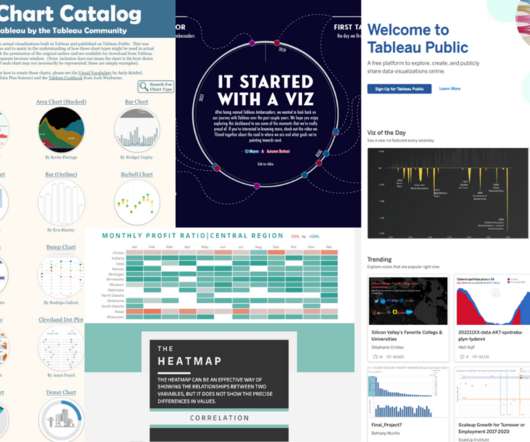
Director, Tableau Public. Collage of Tableau Public visualizations ( The Tableau Chart Catalog by Kevin Flerlage, The Tableau Chart Builder by Jeff Plattner, and It Started With A Viz | VOTD by Autumn Battani) and the Tableau Public homepage. Fred Najjar, Tableau Public Ambassador. Taha Ebrahimi.
Director, Tableau Public. Collage of Tableau Public visualizations ( The Tableau Chart Catalog by Kevin Flerlage, The Tableau Chart Builder by Jeff Plattner, and It Started With A Viz | VOTD by Autumn Battani) and the Tableau Public homepage. Fred Najjar, Tableau Public Ambassador. Taha Ebrahimi.
Visualizing the risks . Kelly and her team at Headwaters Economics used Tableau to create two powerful dashboards to visualize the inequitable realities of wildfire risk and help decision makers find solutions. If you click on a county, a hyperlink is generated that allows you to download a report specific to that county.
Visualizing the risks. Kelly and her team at Headwaters Economics used Tableau to create two powerful dashboards to visualize the inequitable realities of wildfire risk and help decision makers find solutions. If you click on a county, a hyperlink is generated that allows you to download a report specific to that county.
For outside use, a service such as Teamlogs also offers transcription, speaker separation, and in-browser text editing prior to download. Datavisualization For a long time, Tableau led the industry in datavisualization. One table but multiple data presentation options Take Tomat.ai , for example.
Its great for social media graphics, ads, and quick visual touch-ups. Pixlr Pixlr s AI-powered online editor offers advanced image manipulation without requiring software downloads. TableauTableau enhances datavisualization with AI-driven analytics , helping users create interactive dashboards, detect patterns, and forecast trends.
We organize all of the trending information in your field so you don't have to. Join 17,000+ users and stay up to date on the latest articles your peers are reading.
You know about us, now we want to get to know you!
Let's personalize your content
Let's get even more personalized
We recognize your account from another site in our network, please click 'Send Email' below to continue with verifying your account and setting a password.


Let's personalize your content