This site uses cookies to improve your experience. To help us insure we adhere to various privacy regulations, please select your country/region of residence. If you do not select a country, we will assume you are from the United States. Select your Cookie Settings or view our Privacy Policy and Terms of Use.
Cookie Settings
Cookies and similar technologies are used on this website for proper function of the website, for tracking performance analytics and for marketing purposes. We and some of our third-party providers may use cookie data for various purposes. Please review the cookie settings below and choose your preference.
Used for the proper function of the website
Used for monitoring website traffic and interactions
Cookie Settings
Cookies and similar technologies are used on this website for proper function of the website, for tracking performance analytics and for marketing purposes. We and some of our third-party providers may use cookie data for various purposes. Please review the cookie settings below and choose your preference.
Strictly Necessary: Used for the proper function of the website
Performance/Analytics: Used for monitoring website traffic and interactions
Introduction Exploratory Data Analysis is a method of evaluating or comprehending data in order to derive insights or key characteristics. EDA can be divided into two categories: graphical analysis and non-graphical analysis. EDA is a critical component of any data science or machinelearning process.
ArticleVideo Book Understand the ML best practice and project roadmap When a customer wants to implement ML(MachineLearning) for the identified business problem(s) after. The post Rapid-Fire EDA process using Python for ML Implementation appeared first on Analytics Vidhya.
Introduction In the realm of data science, the initial step towards understanding and analyzing data involves a comprehensive exploratory data analysis (EDA). This process is pivotal for recognizing patterns, identifying anomalies, and establishing hypotheses.
Table of Contents Introduction Working with dataset Creating loss dataframe Visualizations Analysis from Heatmap Overall Analysis Conclusion Introduction In this article, I am going to perform Exploratory Data Analysis on the Sample Superstore dataset. The link for the Dataset is: [link] You can download it […].
Top YouTube Channels for LearningData Science; DataVisualization in Python with Seaborn; Deploy a MachineLearning Web App with Heroku; How to Ace Data Science Assessment Test by Using Automatic EDA Tools; Will DeepMind’s AlphaCode Replace Programmers?
This article was published as a part of the Data Science Blogathon. Introduction The MachineLearning life cycle or MachineLearning Development Life Cycle to be precise can be said as a set of guidelines which need to be followed when we build machinelearning-based projects.
ChatGPT can also use Wolfram Language to perform more complex tasks, such as simulating physical systems or training machinelearning models. Deploy machinelearning Models: You can use the plugin to train and deploy machinelearning models. Source: Datacamp 4.
This article was published as a part of the Data Science Blogathon. Introduction Exploratory Data Analysis, or EDA, examines the data and identifies potential relationships between variables using numerical summaries and visualisations.
Introduction Analytics Vidhya DataHour is designed to provide valuable insights and knowledge to individuals looking to build a career in the data-tech industry. These sessions cover a wide range of topics, from the fields of artificial intelligence, and machinelearning, and various topics related to data science.
Building an End-to-End MachineLearning Project to Reduce Delays in Aggressive Cancer Care. This article seeks to also explain fundamental topics in data science such as EDA automation, pipelines, ROC-AUC curve (how results will be evaluated), and Principal Component Analysis in a simple way. Figure 5: Code Magic!
1, Data is the new oil, but labeled data might be closer to it Even though we have been in the 3rd AI boom and machinelearning is showing concrete effectiveness at a commercial level, after the first two AI booms we are facing a problem: lack of labeled data or data themselves.
The importance of EDA in the machinelearning world is well known to its users. Making visualizations is one of the finest ways for data scientists to explain data analysis to people outside the business. The EDA, the first chance for visualizations, will be the main topic of this article.
Summary: Data Analysis focuses on extracting meaningful insights from raw data using statistical and analytical methods, while datavisualization transforms these insights into visual formats like graphs and charts for better comprehension. EDA: Calculate overall churn rate. Its about storytelling with data.
There are many well-known libraries and platforms for data analysis such as Pandas and Tableau, in addition to analytical databases like ClickHouse, MariaDB, Apache Druid, Apache Pinot, Google BigQuery, Amazon RedShift, etc. Datavisualization can help here by visualizing your datasets.
But make no mistake; data science is not a solitary endeavor; it’s a ballet of complexities and creativity. Data scientists waltz through intricate datasets, twirling with statistical tools and machinelearning techniques. Exploring the question, “What does a data scientist do?
It involves steps like handling missing values, normalizing data, and managing categorical features, ultimately enhancing model performance and ensuring data quality. Introduction Data preprocessing is a critical step in the MachineLearning pipeline, transforming raw data into a clean and usable format.
Mathematics for MachineLearning and Data Science Specialization Proficiency in Programming Data scientists need to be skilled in programming languages commonly used in data science, such as Python or R. These languages are used for data manipulation, analysis, and building machinelearning models.
Proficient in programming languages like Python or R, data manipulation libraries like Pandas, and machinelearning frameworks like TensorFlow and Scikit-learn, data scientists uncover patterns and trends through statistical analysis and datavisualization. Big Data Technologies: Hadoop, Spark, etc.
In the digital age, the abundance of textual information available on the internet, particularly on platforms like Twitter, blogs, and e-commerce websites, has led to an exponential growth in unstructured data. Text data is often unstructured, making it challenging to directly apply machinelearning algorithms for sentiment analysis.
Exploratory Data Analysis(EDA)on Biological Data: A Hands-On Guide Unraveling the Structural Data of Proteins, Part II — Exploratory Data Analysis Photo from Pexels In a previous post, I covered the background of this protein structure resolution data set, including an explanation of key data terminology and details on how to acquire the data.
Build a Stocks Price Prediction App powered by Snowflake, AWS, Python and Streamlit — Part 2 of 3 A comprehensive guide to develop machinelearning applications from start to finish. Introduction Welcome Back, Let's continue with our Data Science journey to create the Stock Price Prediction web application.
Fantasy Football is a popular pastime for a large amount of the world, we gathered data around the past 6 seasons of player performance data to see what our community of data scientists could create. This report took the data set provided in the challenge, as well as external data feeds and alternative sources.
You will collect and clean data from multiple sources, ensuring it is suitable for analysis. You will perform Exploratory Data Analysis to uncover patterns and insights hidden within the data. Also Read: Explore data effortlessly with Python Libraries for (Partial) EDA: Unleashing the Power of Data Exploration.
Objectives The challenge embraced several data analysis dimensions: from data cleaning and exploratory data analysis (EDA) to insightful datavisualization and predictive modeling.
Descriptive Analytics Projects: These projects focus on summarizing historical data to gain insights into past trends and patterns. Examples include generating reports, dashboards, and datavisualizations to understand business performance, customer behavior, or operational efficiency.
Example Use Cases Matplotlib is ideal for Data Analysis , scientific research, and MachineLearning projects. Researchers and analysts commonly use it to explore data distributions, plot trends, and present findings. Key Features Simplicity and Speed: Focused on quick and easy datavisualization capabilities.
These are common Python libraries used for data analysis and visualization. Exploratory Data Analysis (EDA) Univariate EDA Price: The price of a used car is the target variable and has a highly skewed distribution, with a median value of around 53.5 The price is higher for used cars with automatic transmission.
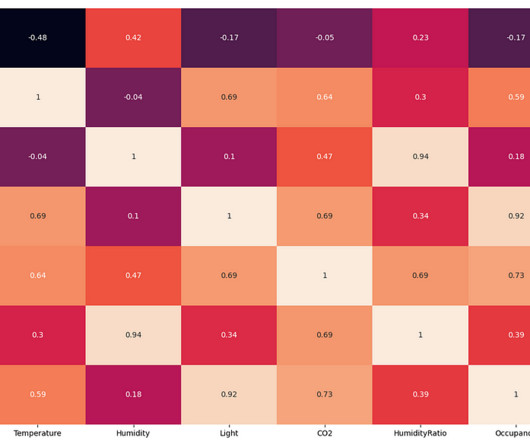
This project aims to predict whether a room is occupied based on the data collected from the sensors. The data set is collected from the UCI MachineLearning Repository. The data set contains 7 attributes: date, temperature, humidity, light, CO2, humidity ratio, and occupancy.
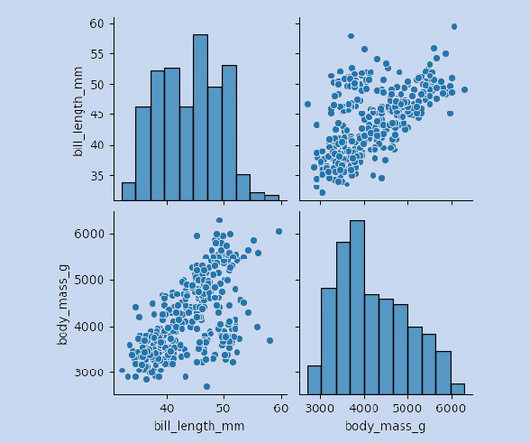
Datavisualization is an indispensable aspect of any data science project, playing a pivotal role in gaining insights and communicating findings effectively. What is datavisualization? What is datavisualization? Why do we choose Python datavisualization tools for our projects?
We organize all of the trending information in your field so you don't have to. Join 17,000+ users and stay up to date on the latest articles your peers are reading.
You know about us, now we want to get to know you!
Let's personalize your content
Let's get even more personalized
We recognize your account from another site in our network, please click 'Send Email' below to continue with verifying your account and setting a password.


Let's personalize your content