This site uses cookies to improve your experience. To help us insure we adhere to various privacy regulations, please select your country/region of residence. If you do not select a country, we will assume you are from the United States. Select your Cookie Settings or view our Privacy Policy and Terms of Use.
Cookie Settings
Cookies and similar technologies are used on this website for proper function of the website, for tracking performance analytics and for marketing purposes. We and some of our third-party providers may use cookie data for various purposes. Please review the cookie settings below and choose your preference.
Used for the proper function of the website
Used for monitoring website traffic and interactions
Cookie Settings
Cookies and similar technologies are used on this website for proper function of the website, for tracking performance analytics and for marketing purposes. We and some of our third-party providers may use cookie data for various purposes. Please review the cookie settings below and choose your preference.
Strictly Necessary: Used for the proper function of the website
Performance/Analytics: Used for monitoring website traffic and interactions
Their role is crucial in understanding the underlying data structures and how to leverage them for insights. Key Skills Proficiency in SQL is essential, along with experience in datavisualization tools such as Tableau or PowerBI.
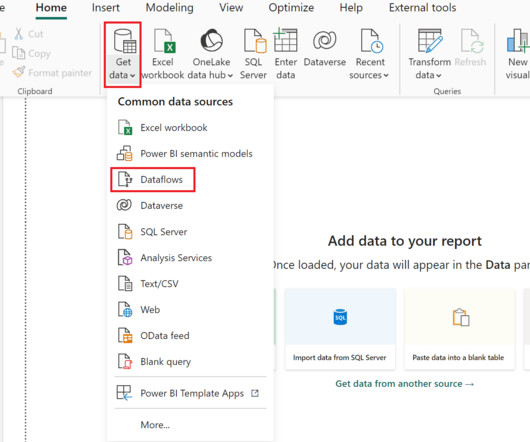
We at phData have written extensively about creating centralized data products in PowerBI. Most PowerBI developers are familiar with Power Query , Which is the data transformation layer of PowerBI. This step can be performed as many times as needed across as many data models.
Consequently, the tools we employ to process and visualize this data play a critical role. Among these tools, KNIME and PowerBI have emerged as key players, catering to the demands of this evolving landscape. In this blog, we will focus on integrating PowerBI within KNIME for enhanced data analytics.
Steps Involved in the Data Analysis Process (General Steps to Follow as a Data Analyst) Gather the data in any spreadsheet or database and gain a basic understanding of the data that you have using any statistical techniques or by writing SQL Queries. In this process, I am going to use PowerBI and Excel.
Data science bootcamps are intensive short-term educational programs designed to equip individuals with the skills needed to enter or advance in the field of data science. They cover a wide range of topics, ranging from Python, R, and statistics to machine learning and datavisualization.
These tools offer a wide range of functionalities to handle complex data preparation tasks efficiently. The tool also employs AI capabilities for automatically providing attribute names and short descriptions for reports, making it easy to use and efficient for data preparation.
Summary: Business Intelligence Analysts transform raw data into actionable insights. They use tools and techniques to analyse data, create reports, and support strategic decisions. Key skills include SQL, datavisualization, and business acumen. Introduction We are living in an era defined by data.
Business Intelligence tools encompass a variety of software applications designed to collect, process, analyse, and present business data. These tools enable organizations to convert raw data into actionable insights through various means such as reporting, analytics, datavisualization, and performance management.
It is the process of converting raw data into relevant and practical knowledge to help evaluate the performance of businesses, discover trends, and make well-informed choices. Data gathering, data integration, data modelling, analysis of information, and datavisualization are all part of intelligence for businesses.
The project I did to land my business intelligence internship — CAR BRAND SEARCH ETL PROCESS WITH PYTHON, POSTGRESQL & POWERBI 1. Section 2: Explanation of the ETL diagram for the project. Section 4: Reporting data for the project insights. ETL ARCHITECTURE DIAGRAM ETL stands for Extract, Transform, Load.
As you’ll see below, however, a growing number of data analytics platforms, skills, and frameworks have altered the traditional view of what a data analyst is. Data Presentation: Communication Skills, DataVisualization Any good data analyst can go beyond just number crunching.
Data engineers are essential professionals responsible for designing, constructing, and maintaining an organization’s data infrastructure. They create data pipelines, ETL processes, and databases to facilitate smooth data flow and storage. DataVisualization: Matplotlib, Seaborn, Tableau, etc.
Data Integration Once data is collected from various sources, it needs to be integrated into a cohesive format. Data Quality Management : Ensures that the integrated data is accurate, consistent, and reliable for analysis. These tools work together to facilitate efficient data management and analysis processes.
This allows for it to be integrated with many different tools and technologies to improve data management and analysis workflows. One set of tools that are becoming more important in our data-driven world is BI tools. Think of Tableau, PowerBI, and QlikView.
They may also be involved in data modeling and database design. BI developer: A BI developer is responsible for designing and implementing BI solutions, including data warehouses, ETL processes, and reports. They may also be involved in data integration and data quality assurance.
They may also be involved in data modeling and database design. BI developer: A BI developer is responsible for designing and implementing BI solutions, including data warehouses, ETL processes, and reports. They may also be involved in data integration and data quality assurance.
It is known to have benefits in handling data due to its robustness, speed, and scalability. A typical modern data stack consists of the following: A data warehouse. Data ingestion/integration services. Reverse ETL tools. Data orchestration tools. Business intelligence (BI) platforms.
Knowledge of Core Data Engineering Concepts Ensure one possess a strong foundation in core data engineering concepts, which include data structures, algorithms, database management systems, data modeling , data warehousing , ETL (Extract, Transform, Load) processes, and distributed computing frameworks (e.g.,
This comprehensive blog outlines vital aspects of Data Analyst interviews, offering insights into technical, behavioural, and industry-specific questions. It covers essential topics such as SQL queries, datavisualization, statistical analysis, machine learning concepts, and data manipulation techniques.
Data Integration Tools Technologies such as Apache NiFi and Talend help in the seamless integration of data from various sources into a unified system for analysis. Understanding ETL (Extract, Transform, Load) processes is vital for students. Understanding how to assess model performance is crucial for data scientists.
Data Engineerings SteadyGrowth 20182021: Data engineering was often mentioned but overshadowed by modeling advancements. 20222024: As AI models required larger and cleaner datasets, interest in data pipelines, ETL frameworks, and real-time data processing surged.
Apache Airflow Apache Airflow is a workflow automation tool that allows data engineers to schedule, monitor, and manage data pipelines efficiently. It helps streamline data processing tasks and ensures reliable execution. It helps organisations understand their data better and make informed decisions.
We organize all of the trending information in your field so you don't have to. Join 17,000+ users and stay up to date on the latest articles your peers are reading.
You know about us, now we want to get to know you!
Let's personalize your content
Let's get even more personalized
We recognize your account from another site in our network, please click 'Send Email' below to continue with verifying your account and setting a password.


Let's personalize your content