This site uses cookies to improve your experience. To help us insure we adhere to various privacy regulations, please select your country/region of residence. If you do not select a country, we will assume you are from the United States. Select your Cookie Settings or view our Privacy Policy and Terms of Use.
Cookie Settings
Cookies and similar technologies are used on this website for proper function of the website, for tracking performance analytics and for marketing purposes. We and some of our third-party providers may use cookie data for various purposes. Please review the cookie settings below and choose your preference.
Used for the proper function of the website
Used for monitoring website traffic and interactions
Cookie Settings
Cookies and similar technologies are used on this website for proper function of the website, for tracking performance analytics and for marketing purposes. We and some of our third-party providers may use cookie data for various purposes. Please review the cookie settings below and choose your preference.
Strictly Necessary: Used for the proper function of the website
Performance/Analytics: Used for monitoring website traffic and interactions
Ateken Abla March 19, 2024 - 9:05pm Larissa Amoroso Vice President, Tableau Community, Tableau When Karolina Grodzinska took the stage at Tableau Conference as part of her Iron Viz: Student Edition award, it felt like the culmination of her data learning, which started in 2021. How did Karolina discover Tableau? “It
Lead Solutions Engineer, Tableau. Tableau Conference 2022 was unmistakably the latter, as summed up by Sarah Bartlett , one of the many data lovers who attended TC22 in Las Vegas last month. . The Vegas event offered a smorgasbord of absolutely fantastic sessions, many by and for the community. Bronwen Boyd. June 4, 2022.
A data scientist could analyze sales data, customer surveys, and social media trends to determine the reason. They might find that it’s because of a popular deal or event on Tuesdays. Python, R, and SQL: These are the most popular programming languages for data science.
Their role is crucial in understanding the underlying data structures and how to leverage them for insights. Key Skills Proficiency in SQL is essential, along with experience in datavisualization tools such as Tableau or Power BI.
Social Media and Blog Specialist, Tableau. Tableau Ambassadors teach and share while fostering a positive and supportive space within the data community. Tableau Ambassadors serve one-year terms in one of seven branches: Forums, User Groups, Student, DataDev, Public, Social, and CRM Analytics. Bronwen Boyd. Britt Staniar.
Lead Solutions Engineer, Tableau. Tableau Conference 2022 was unmistakably the latter, as summed up by Sarah Bartlett , one of the many data lovers who attended TC22 in Las Vegas last month. . The Vegas event offered a smorgasbord of absolutely fantastic sessions, many by and for the community. Bronwen Boyd. June 4, 2022.
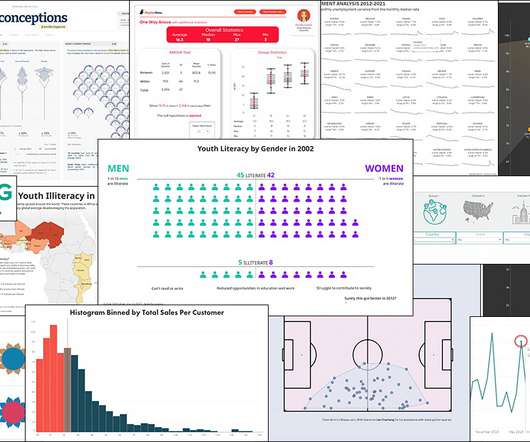
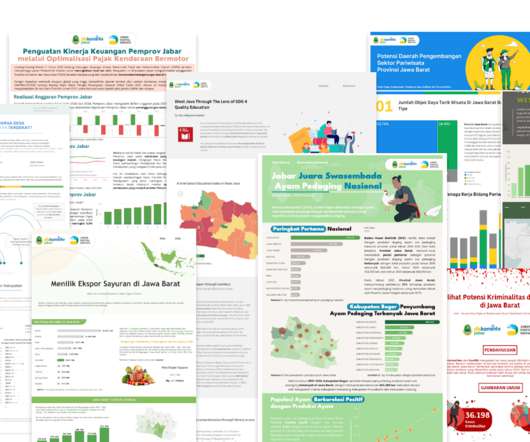
Gandes Goldestan Business Intelligence Analyst Jabar Digital Service Sarah Molina January 24, 2023 - 8:29pm January 25, 2023 Tableau plays a huge role in helping users get to insights quickly while telling impactful stories using their data. All visualizations were published on Tableau Public.
Britt Staniar Senior Community Program Manager, Recognition Programs Ateken Abla June 12, 2023 - 10:41pm June 14, 2023 Nominations and applications for the 2023 Tableau Ambassador Program are now open. What do Tableau Ambassadors do? Finally, Tableau Ambassadors advocate for under-represented voices within our community.
Nominations and applications for the 2022 Tableau Ambassador Program are now open. What do Tableau Ambassadors do? Tableau Ambassadors are leaders in our community and data champions who want to bring analytics to everyone. Learn more about the Tableau Ambassadors on our website. Already know it all?
Gandes Goldestan Business Intelligence Analyst Jabar Digital Service Sarah Molina January 24, 2023 - 8:29pm January 25, 2023 Tableau plays a huge role in helping users get to insights quickly while telling impactful stories using their data. All visualizations were published on Tableau Public.
Every year that the Tableau Foundation team has hosted the Tableau Foundation Summit, we have chosen the event theme thoughtfully. We want it to reflect the work of our partners and the strides they are taking to make the world a better place with data. . Watch the Tableau Foundation Virtual Summit 2021.
Kuber Sharma Director, Product Marketing, Tableau Kristin Adderson August 22, 2023 - 12:11am August 22, 2023 Whether you're a novice data analyst exploring the possibilities of Tableau or a leader with years of experience using VizQL to gain advanced insights—this is your list of key Tableau features you should know, from A to Z.
A data scientist could analyze sales data, customer surveys, and social media trends to determine the reason. They might find that it’s because of a popular deal or event on Tuesdays. Python, R, and SQL: These are the most popular programming languages for data science.
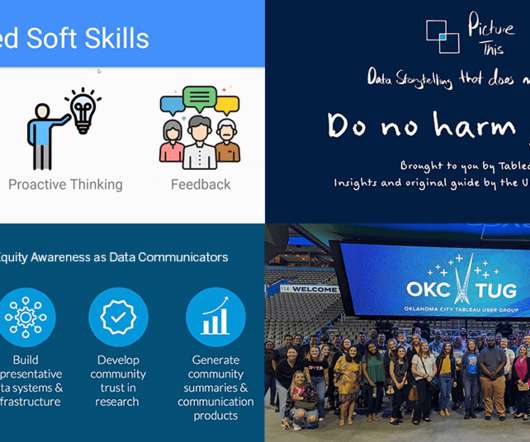
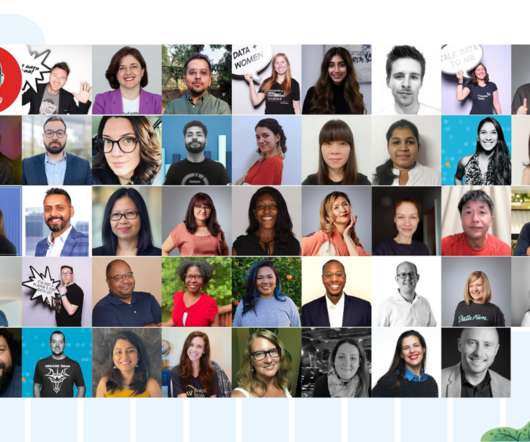
Senior Manager, Community Programs & Engagement at Tableau. Data is a powerful tool to reveal insights, ignite conversations, and drive change—whether you’re looking to solve business problems or address injustices in your community. Tableau Community Equity Task Force. Kristin Adderson. February 23, 2021 - 9:49pm.
Sarah Molina May 1, 2024 - 3:25pm Emily Kund DataVisualization Specialist: Visual Analytics and Accessibility Consultant Matt Francis Wellcome Trust Sanger Institute For the community, by the community. The 2024 winner is: Gbóláhàn Adébáyò Prepstar They help us prepare our data so we don’t prepare to fail. It's a tie!
Academic Program Senior Specialist, Tableau. Tableau Ambassadors teach and share while fostering a positive and supportive space within the data community. Tableau Ambassadors serve one-year terms in one of seven branches: Forums, User Groups, Student, DataDev, Public, Social, and CRM Analytics. Bergen Schmetzer.
Welcome to the Tableau User Group Monthly, where you can find a curated list of highlights and content from a month of User Group events all over the globe. What are Tableau User Groups? Tableau User Groups (TUGs) are inclusive meetup events for Tableau enthusiasts to connect, learn and discuss all things Tableau.
Director, Community Programs & Engagement at Tableau. While there is no single way to accelerate your data skills, all roads lead through the Tableau Community. Within the Community, you’ll find a collection of resources and activities designed to further your data journey and connect you with like-minded people. .
Director, Community Programs & Engagement at Tableau. While there is no single way to accelerate your data skills, all roads lead through the Tableau Community. Within the Community, you’ll find a collection of resources and activities designed to further your data journey and connect you with like-minded people. .
In the world of datavisualization , the ability to produce material that can speak to your audience, regardless of their technical expertise, is an ever-important factor to consider. Tableau Public Tableau Public , a powerful datavisualization software, empowers users to create interactive and shareable dashboards with ease.
Be sure to check out his talk, “ A Practical Introduction to DataVisualization for Data Scientists ,” there! There are many ways to create visualizations, between chart choosers, chart wizards, GUI-based tools of various flavors, and of course, many libraries if you’re looking to use code.
Senior Manager, Community Programs & Engagement at Tableau. Data is a powerful tool to reveal insights, ignite conversations, and drive change—whether you’re looking to solve business problems or address injustices in your community. Tableau Community Equity Task Force. Kristin Adderson. February 23, 2021 - 9:49pm.
Social Media and Blog Specialist, Tableau. Tableau Ambassadors teach and share while fostering a positive and supportive space within the data community. Tableau Ambassadors serve one-year terms in one of seven branches: Forums, User Groups, Student, DataDev, Public, Social, and CRM Analytics. Bronwen Boyd. Britt Staniar.
Social Media and Blog Specialist, Tableau. Tableau Ambassadors teach and share while fostering a positive and supportive space within the data community. Tableau Ambassadors serve one-year terms in one of seven branches: Forums, User Groups, Student, DataDev, Public, Social, and CRM Analytics. Bronwen Boyd. Britt Staniar.
Gorga (@StyleSTEAMed) February 16, 2022 Back in December 2021, Tableau Visionary HOF Bridget Cogley put out a call to the DataFam to create new initiatives. Through discussions on Twitter, Tableau Social Ambassador, Christina Gorga was inspired to organize a data challenge that was more niche than the current active data challenges.
Larissa Amoroso Senior Director, Tableau Community, Tableau Ateken Abla July 31, 2023 - 10:22pm August 5, 2023 Analytics is essential for the future of work as more organizations embrace data to make decisions, delight customers, track progress, and innovate their products and offerings.
Nominations and applications for the 2022 Tableau Ambassador Program are now open. What do Tableau Ambassadors do? Tableau Ambassadors are leaders in our community and data champions who want to bring analytics to everyone. Learn more about the Tableau Ambassadors on our website. Already know it all?
Data science bootcamps are intensive short-term educational programs designed to equip individuals with the skills needed to enter or advance in the field of data science. They cover a wide range of topics, ranging from Python, R, and statistics to machine learning and datavisualization.
Every year that the Tableau Foundation team has hosted the Tableau Foundation Summit, we have chosen the event theme thoughtfully. We want it to reflect the work of our partners and the strides they are taking to make the world a better place with data. . Watch the Tableau Foundation Virtual Summit 2021.
“It becomes very inspiring when you can show your organization the data and insights that you found and what you did with that information,” said Jennifer Day, vice president of customer strategy and programs at Tableau. “It In addition, forums moderated by data specialists can become indispensable roundups of solutions.
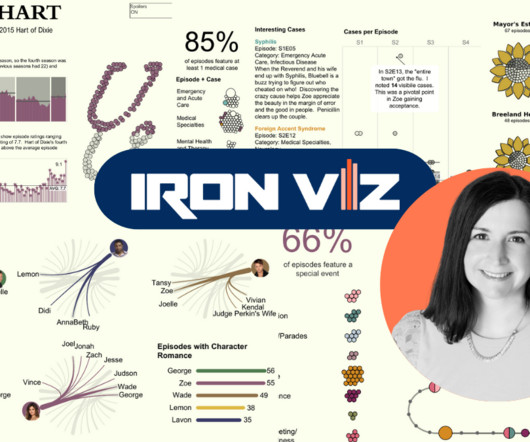
Iron Viz is a chance to prove to the world and myself what I'm capable of, and each time I learn something new about Tableau, data collection, and transformation.” Making it through to the finals at Tableau Conference makes the Iron Viz experience much more intense, she adds. The biggest thing about Tableau is the support.
Larissa Amoroso Senior Director, Tableau Community, Tableau Ateken Abla July 31, 2023 - 10:22pm August 5, 2023 Analytics is essential for the future of work as more organizations embrace data to make decisions, delight customers, track progress, and innovate their products and offerings.
You will be listening to the requirements of the clients, combining this with the data, and matching them up with the most appropriate solutions. Business analysts are concerned with looking at data and events, making sure negative events do not occur again and choosing and implementing solutions to ensure that this is the case.
Each platform offers unique features and benefits, making it vital for data engineers to understand their differences. These tools provide scalability and ease of use, making them ideal for enterprises that require robust data processing capabilities. Interested in attending an ODSC event?
Diagnostic analytics: Diagnostic analytics helps pinpoint the reason an event occurred. js and TableauData science, data analytics and IBM Practicing data science isn’t without its challenges. Manufacturers can analyze a failed component on an assembly line and determine the reason behind its failure.
“It becomes very inspiring when you can show your organization the data and insights that you found and what you did with that information,” said Jennifer Day, vice president of customer strategy and programs at Tableau. “It In addition, forums moderated by data specialists can become indispensable roundups of solutions.
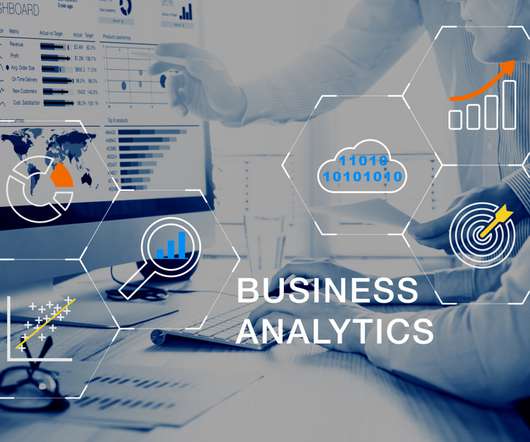
A business career path is a constantly evolving one that requires individuals to stay up-to-date with the latest trends and technologies Relevant certifications, such as those offered by Microsoft, IBM, or Tableau, can also help demonstrate expertise in BI tools and techniques.
A business career path is a constantly evolving one that requires individuals to stay up-to-date with the latest trends and technologies Relevant certifications, such as those offered by Microsoft, IBM, or Tableau, can also help demonstrate expertise in BI tools and techniques.
Because they are the most likely to communicate data insights, they’ll also need to know SQL, and visualization tools such as Power BI and Tableau as well. Machine Learning Engineer Machine learning engineers will use data much differently than business analysts or data analysts. Well then, you’re in luck.
Summary: Leveraging data skills for Financial Analysts explores how Financial Analysts can harness data skills to enhance their roles. It delves into data analysis techniques to interpret financial trends effectively, including statistical analysis and datavisualization. appeared first on Pickl.AI.
Anomaly Detection: Time series analysis helps identify unusual events or anomalies in the data. For instance, detecting unique data traffic patterns in network security can help uncover potential cyberattacks. Tableau: Tableau is a datavisualization tool that can be used for time series datavisualization and exploration.
Predictive Analytics for Disease Prevention Predictive analytics is a powerful tool in the arsenal of healthcare Data Scientists. By analyzing historical data and identifying patterns, Predictive analytics can forecast future health events, enabling early intervention and prevention.
DataVisualizationData scientists may be expected to know some basic datavisualization to help tell a story with their data and algorithms. Luckily, nothing too complicated is needed, as Tableau is user-friendly while matplotlib is the popular Python library for datavisualization.
Data Streaming Learning about real-time data collection methods using tools like Apache Kafka and Amazon Kinesis. Students should understand the concepts of event-driven architecture and stream processing. Once data is collected, it needs to be stored efficiently. js for creating interactive visualisations.
We organize all of the trending information in your field so you don't have to. Join 17,000+ users and stay up to date on the latest articles your peers are reading.
You know about us, now we want to get to know you!
Let's personalize your content
Let's get even more personalized
We recognize your account from another site in our network, please click 'Send Email' below to continue with verifying your account and setting a password.


Let's personalize your content