This site uses cookies to improve your experience. To help us insure we adhere to various privacy regulations, please select your country/region of residence. If you do not select a country, we will assume you are from the United States. Select your Cookie Settings or view our Privacy Policy and Terms of Use.
Cookie Settings
Cookies and similar technologies are used on this website for proper function of the website, for tracking performance analytics and for marketing purposes. We and some of our third-party providers may use cookie data for various purposes. Please review the cookie settings below and choose your preference.
Used for the proper function of the website
Used for monitoring website traffic and interactions
Cookie Settings
Cookies and similar technologies are used on this website for proper function of the website, for tracking performance analytics and for marketing purposes. We and some of our third-party providers may use cookie data for various purposes. Please review the cookie settings below and choose your preference.
Strictly Necessary: Used for the proper function of the website
Performance/Analytics: Used for monitoring website traffic and interactions
It is practically impossible to test it on every single member of the population. Inferential statistics employ techniques such as hypothesistesting and regression analysis (also discussed later) to determine the likelihood of observed patterns occurring by chance and to estimate population parameters.
Statistical analysis and hypothesistesting Statistical methods provide powerful tools for understanding data. An Applied Data Scientist must have a solid understanding of statistics to interpret data correctly. Machinelearning algorithms Machinelearning forms the core of Applied Data Science.
This plot is particularly useful for tasks like hypothesistesting, anomaly detection, and model evaluation. Suppose you are a data scientist working for an e-commerce company. Bias-Variance tradeoff: Understanding the tradeoff between bias and variance is fundamental in machinelearning.
Machinelearning engineer vs data scientist: two distinct roles with overlapping expertise, each essential in unlocking the power of data-driven insights. As businesses strive to stay competitive and make data-driven decisions, the roles of machinelearning engineers and data scientists have gained prominence.
First, the amount of data available to organizations has grown exponentially in recent years, creating a need for professionals who can make sense of it. Second, advancements in technology, such as big data and machinelearning, have made it easier and more efficient to analyze data.
Data science bootcamps are intensive short-term educational programs designed to equip individuals with the skills needed to enter or advance in the field of data science. They cover a wide range of topics, ranging from Python, R, and statistics to machinelearning and datavisualization.
Summary: Data Analysis focuses on extracting meaningful insights from raw data using statistical and analytical methods, while datavisualization transforms these insights into visual formats like graphs and charts for better comprehension. Deep Dive: What is DataVisualization?
Steps to Perform DataVisualization: Datavisualization is the presentation of information and statistics using visual tools that include charts, graphs, and maps. Its goal is to create patterns in data, trends, and anomalies comprehensible to both data professionals and people without technical knowledge.
What do machinelearning engineers do? They design, develop, and deploy the machinelearning algorithms that power everything from self-driving cars to personalized recommendations. What do machinelearning engineers do? Does a machinelearning engineer do coding? They build the future.
Aspiring Data Scientists must equip themselves with a diverse skill set encompassing technical expertise, analytical prowess, and domain knowledge. Whether you’re venturing into machinelearning, predictive analytics, or datavisualization, honing the following top Data Science skills is essential for success.
Proficient in programming languages like Python or R, data manipulation libraries like Pandas, and machinelearning frameworks like TensorFlow and Scikit-learn, data scientists uncover patterns and trends through statistical analysis and datavisualization. Big Data Technologies: Hadoop, Spark, etc.
Techniques such as descriptive statistics (mean, median, mode) allow data scientists to understand the dataset’s characteristics better, ensuring that the analysis is built on a solid foundation. HypothesisTestingHypothesistesting is a vital aspect of statistics that allows data scientists to validate assumptions about a dataset.
R is a popular programming language and environment widely used in the field of data science. It provides a comprehensive suite of tools, libraries, and packages specifically designed for statistical analysis, data manipulation, visualization, and machinelearning.
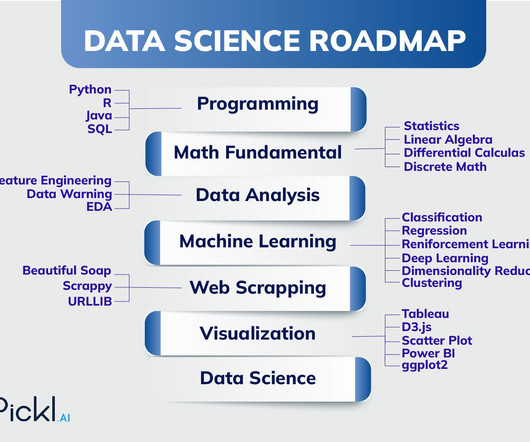
Key Takeaways: Data Science is a multidisciplinary field bridging statistics, mathematics, and computer science to extract insights from data. The roadmap to becoming a Data Scientist involves mastering programming, statistics, machinelearning, datavisualization, and domain knowledge.
Clean and preprocess data to ensure its quality and reliability. Statistical Analysis: Apply statistical techniques to analyse data, including descriptive statistics, hypothesistesting, regression analysis, and machinelearning algorithms. This includes randomization, control groups, and minimising bias.
Statistical Analysis Introducing statistical methods and techniques for analysing data, including hypothesistesting, regression analysis, and descriptive statistics. Students should gain a foundational understanding of statistics as it applies to data analytics. What are the Ethical Considerations in Big Data?
Introduction to Data Science Courses Data Science courses come in various shapes and sizes. There are beginner-friendly programs focusing on foundational concepts, while more advanced courses delve into specialized areas like machinelearning or natural language processing. Course Focus Data Science is a vast field.
Data Cleaning is a crucial step in any data analysis process, and it’s important to showcase your ability to handle messy data effectively. DataVisualization: Create compelling and informative DataVisualizations. Visual Appeal: Use clean and visually appealing DataVisualizations.
This comprehensive blog outlines vital aspects of Data Analyst interviews, offering insights into technical, behavioural, and industry-specific questions. It covers essential topics such as SQL queries, datavisualization, statistical analysis, machinelearning concepts, and data manipulation techniques.
Examples of unstructured data include text files, images, audio, and video content. While unstructured data may seem chaotic, advancements in artificial intelligence and machinelearning enable us to extract valuable insights from this data type. Examples of Descriptive Analytics: a. Key Features: i.
You will collect and clean data from multiple sources, ensuring it is suitable for analysis. You will perform Exploratory Data Analysis to uncover patterns and insights hidden within the data. Visualising data makes it easier to identify anomalies and understand distributions.
Read the full blog here — [link] Data Science Interview Questions for Freshers 1. What is Data Science? Once the exploratory steps are completed, the cleansed data is subjected to various algorithms like predictive analysis, regression, text mining, recognition patterns, etc depending on the requirements. Explain it’s working.
We organize all of the trending information in your field so you don't have to. Join 17,000+ users and stay up to date on the latest articles your peers are reading.
You know about us, now we want to get to know you!
Let's personalize your content
Let's get even more personalized
We recognize your account from another site in our network, please click 'Send Email' below to continue with verifying your account and setting a password.


Let's personalize your content