This site uses cookies to improve your experience. To help us insure we adhere to various privacy regulations, please select your country/region of residence. If you do not select a country, we will assume you are from the United States. Select your Cookie Settings or view our Privacy Policy and Terms of Use.
Cookie Settings
Cookies and similar technologies are used on this website for proper function of the website, for tracking performance analytics and for marketing purposes. We and some of our third-party providers may use cookie data for various purposes. Please review the cookie settings below and choose your preference.
Used for the proper function of the website
Used for monitoring website traffic and interactions
Cookie Settings
Cookies and similar technologies are used on this website for proper function of the website, for tracking performance analytics and for marketing purposes. We and some of our third-party providers may use cookie data for various purposes. Please review the cookie settings below and choose your preference.
Strictly Necessary: Used for the proper function of the website
Performance/Analytics: Used for monitoring website traffic and interactions
If the work of a human’s mind can be somehow represented, interactive datavisualization is the closest form of such representation right before pure art. So, what is Interactive datavisualization and how are they driven by modern interactive datavisualization tools? Want to learn more about GoJS?
As the Internet of Things (IoT) continues to revolutionize industries and shape the future, data scientists play a crucial role in unlocking its full potential. A recent article on Analytics Insight explores the critical aspect of data engineering for IoT applications.
The future of 3D printing is heavily reliant on the power of data. The Internet of Things means users will be able to access and print files remotely, as well as create incredible scans and share prints. But, there are also several more opportunities for big data and 3D printing.
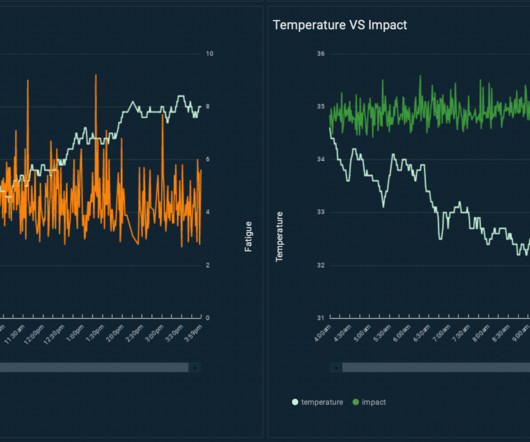
Summary: IoT datavisualization converts raw sensor data into interactive visuals, enabling businesses to monitor trends, detect anomalies, and improve efficiency. Introduction The Internet of Things (IoT) connects billions of devices, generating massive real-time data streams.
You have probably heard a lot talk about the Internet of Things (IoT). It is one of the biggest trends driven by big data. Facility managers can now use new technologies, such as datavisualization dashboards, to view the performance of their building. They can use the data to gather insights and spot trends.
Ultimately, data helps firms understand and improve their processes, reducing money and time spent on wasted resources. IBM estimates that 90% of all data generated by the Internet of Things (IOT) is not analyzed, or utilized in business decision processes.
Here are some of the key types of cloud analytics: Descriptive analytics: This type focuses on summarizing historical data to provide insights into what has happened in the past. It helps organizations understand trends, patterns, and anomalies in their data.
Mechanical designs are increasingly intricate, software development is ever more powerful, not to mention more and more physical products are being incorporated into the internet of things or contain distinct software. The post Cloud-Based Data Storage Is Making Manufacturers More Agile appeared first on SmartData Collective.
By securing the data involved in supply chain operations, data scientists contribute to sustainable procurement and resource management. Environmentally-Friendly IoT Devices The Internet of Things (IoT) has the potential to revolutionize sustainability efforts.
Precision agriculture, also known as smart farming, relies on data-driven technologies to tailor agricultural practices to specific field conditions. By integrating real-time data with AI models, farmers can optimize irrigation schedules, apply fertilizers more efficiently, and detect pest and disease outbreaks early.
The convergence of the Internet of Things (IoT) and Artificial Intelligence (AI) has paved the way for a global smart workplace revolution. As data scientists, understanding the potential of IoT and AI in creating a smart workplace is crucial for shaping the future of work in the digital age.
The automotive industry is on the brink of a technological revolution, powered by the seamless integration of the Internet of Things (IoT). This global transformation is set to redefine the future of transportation, as data-driven insights, connected vehicles, and smart infrastructure create a new era of mobility.
Data collection from smart meters, weather stations, and sensors empowers us to predict energy demand and production. Datavisualization tools translate complex data into clear visuals, fostering stakeholder engagement and driving progress towards a clean energy future. The world is facing a critical juncture.
The advent of the Internet of Things (IoT) further propelled the growth and adoption of M2M, creating an interconnected world where devices communicate seamlessly for improved efficiency and convenience. These objects can collect and exchange data, and they can be controlled remotely.
Summary: This blog dives into the most promising Power BI projects, exploring advanced datavisualization, AI integration, IoT & blockchain analytics, and emerging technologies. Discover best practices for successful implementation and propel your organization towards data-driven success.
In this post, we describe how AWS Partner Airis Solutions used Amazon Lookout for Equipment , AWS Internet of Things (IoT) services, and CloudRail sensor technologies to provide a state-of-the-art solution to address these challenges. We will continue to use QuickSight to build an expanded set of widgets.
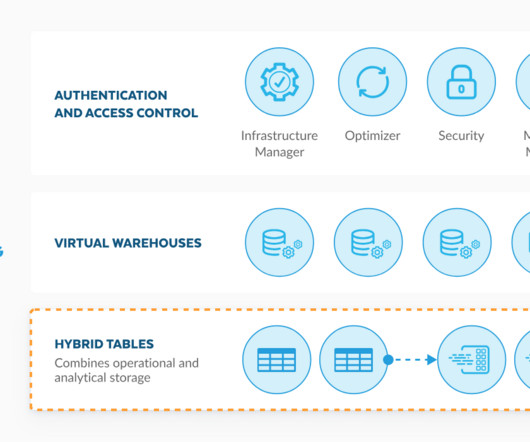
Internet of Things (IoT) Sensor Data: For ingesting and managing sensor data from IoT devices, Hybrid tables can handle the high volume of real-time updates while enabling historical analysis of sensor readings to identify trends or predict equipment failures.
Data Analysis Data analysis is the heart of deriving insights from the gathered information. DataVisualizationDatavisualization transforms complex data sets into intuitive and visually appealing representations. Graphs, charts, and infographics aid in conveying information effectively.
Descriptive Analytics Projects: These projects focus on summarizing historical data to gain insights into past trends and patterns. Examples include generating reports, dashboards, and datavisualizations to understand business performance, customer behavior, or operational efficiency.
“Big data” refers to data sets that are so complex and large they cannot be analyzed or processed using traditional methods. However, despite the complexity of big data, it has become a major part of our digital-centric society.
Join me in understanding the pivotal role of Data Analysts , where learning is not just an option but a necessity for success. Key takeaways Develop proficiency in DataVisualization, Statistical Analysis, Programming Languages (Python, R), Machine Learning, and Database Management.
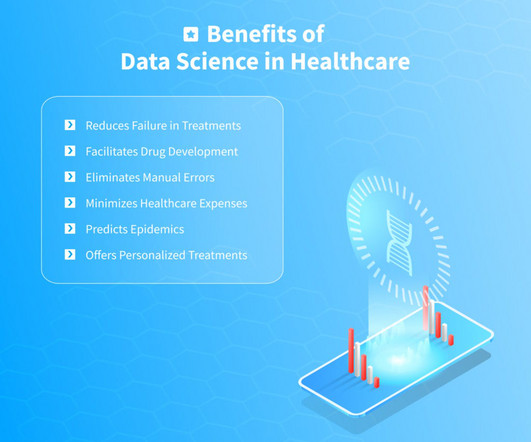
As a discipline that includes various technologies and techniques, data science can contribute to the development of new medications, prevention of diseases, diagnostics, and much more. Utilizing Big Data, the Internet of Things, machine learning, artificial intelligence consulting , etc.,
We organize all of the trending information in your field so you don't have to. Join 17,000+ users and stay up to date on the latest articles your peers are reading.
You know about us, now we want to get to know you!
Let's personalize your content
Let's get even more personalized
We recognize your account from another site in our network, please click 'Send Email' below to continue with verifying your account and setting a password.


Let's personalize your content