This site uses cookies to improve your experience. To help us insure we adhere to various privacy regulations, please select your country/region of residence. If you do not select a country, we will assume you are from the United States. Select your Cookie Settings or view our Privacy Policy and Terms of Use.
Cookie Settings
Cookies and similar technologies are used on this website for proper function of the website, for tracking performance analytics and for marketing purposes. We and some of our third-party providers may use cookie data for various purposes. Please review the cookie settings below and choose your preference.
Used for the proper function of the website
Used for monitoring website traffic and interactions
Cookie Settings
Cookies and similar technologies are used on this website for proper function of the website, for tracking performance analytics and for marketing purposes. We and some of our third-party providers may use cookie data for various purposes. Please review the cookie settings below and choose your preference.
Strictly Necessary: Used for the proper function of the website
Performance/Analytics: Used for monitoring website traffic and interactions
Technical Fellow, Tableau. Innovation is necessary to use data effectively in the pursuit of a better world, particularly because data continues to increase in size and richness. I am proud to announce that my History of Tableau Innovation viz is now published to Tableau Public. Jock Mackinlay. Bronwen Boyd.
Growth Outlook: Companies like Google DeepMind, NASA’s Jet Propulsion Lab, and IBM Research actively seek research data scientists for their teams, with salaries typically ranging from $120,000 to $180,000. With the continuous growth in AI, demand for remote data science jobs is set to rise.
Chief Product Officer, Tableau. It's more important than ever in this all digital, work from anywhere world for organizations to use data to make informed decisions. However, most organizations struggle to become data driven. With Tableau, any user can visually explore that data in real time.
ArticleVideo Book Introduction to Artificial Intelligence and Machine Learning Artificial Intelligence (AI) and its sub-field Machine Learning (ML) have taken the world by storm. The post A Comprehensive Step-by-Step Guide to Become an Industry Ready Data Science Professional appeared first on Analytics Vidhya.
It is a powerful tool that can be used to automate many of the tasks involved in data analysis, and it can also help businesses to discover new insights from their data. It has a wide range of machine 6: TableauTableau is a datavisualization software platform that can be used to create interactive dashboards and reports.
Guest author, Tableau DataDev Ambassador. Tableau is an innovator in the field of datavisualization with its ease of use, stunning visualizations, vibrant community, and more contributing to success. Visualization is, and I expect will always be, important to understand and help democratize data.
Introduction The world is transforming by AI, ML, Blockchain, and Data Science drastically, and hence its community is growing rapidly. So, to provide our community with the knowledge they need to master these domains, Analytics Vidhya has launched its DataHour sessions.
Technical Fellow, Tableau. Innovation is necessary to use data effectively in the pursuit of a better world, particularly because data continues to increase in size and richness. I am proud to announce that my History of Tableau Innovation viz is now published to Tableau Public. Jock Mackinlay. Bronwen Boyd.
Guest author, Tableau DataDev Ambassador. Tableau is an innovator in the field of datavisualization with its ease of use, stunning visualizations, vibrant community, and more contributing to success. Visualization is, and I expect will always be, important to understand and help democratize data.
Chief Product Officer, Tableau. It's more important than ever in this all digital, work from anywhere world for organizations to use data to make informed decisions. However, most organizations struggle to become data driven. With Tableau, any user can visually explore that data in real time.
Introduction to Artificial Intelligence and Machine Learning Artificial Intelligence (AI) and its sub-field Machine Learning (ML) have taken the world by storm. The post A Comprehensive Step-by-Step Guide to Become an Industry-Ready Data Science Professional appeared first on Analytics Vidhya.
Augmented analytics is revolutionizing how organizations interact with their data. By harnessing the power of machine learning (ML) and natural language processing (NLP), businesses can streamline their data analysis processes and make more informed decisions. What is augmented analytics?
There are many well-known libraries and platforms for data analysis such as Pandas and Tableau, in addition to analytical databases like ClickHouse, MariaDB, Apache Druid, Apache Pinot, Google BigQuery, Amazon RedShift, etc. Datavisualization can help here by visualizing your datasets.
Data scientists try multiple models, evaluate their performance, and fine-tune some parameters to get better accuracy. DataVisualization and Interpretation To make the data understandable to stakeholders, visualizations are created in the form of charts, graphs, and dashboards.
This involves collecting, cleaning, and analyzing large data sets to identify patterns, trends, and relationships that might otherwise be hidden. Even if you don’t have a degree, you might still be pondering, “How to become a data scientist?” This is where datavisualization comes in.
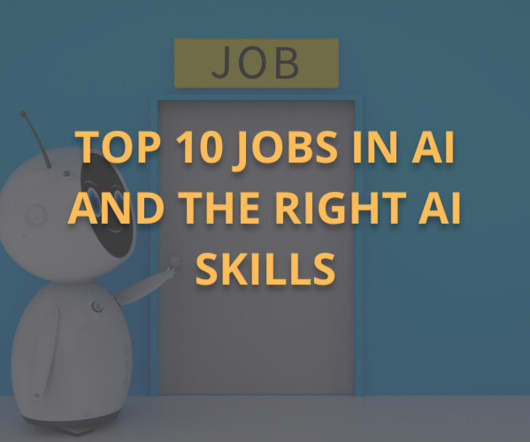
Just as a writer needs to know core skills like sentence structure, grammar, and so on, data scientists at all levels should know core data science skills like programming, computer science, algorithms, and so on. As MLOps become more relevant to ML demand for strong software architecture skills will increase as well.
Key Takeaways Business Analytics targets historical insights; Data Science excels in prediction and automation. Business Analytics requires business acumen; Data Science demands technical expertise in coding and ML. With added skills, professionals can shift between Business Analytics and Data Science.
In this article we will walk through a demo of the PyGWalker package in Python. For this we will use NBA stats from the below web page: Continue reading on MLearning.ai »
As you’ll see below, however, a growing number of data analytics platforms, skills, and frameworks have altered the traditional view of what a data analyst is. Data Presentation: Communication Skills, DataVisualization Any good data analyst can go beyond just number crunching.
This allows for it to be integrated with many different tools and technologies to improve data management and analysis workflows. One set of tools that are becoming more important in our data-driven world is BI tools. Think of Tableau, Power BI, and QlikView.
They employ statistical methods and machine learning techniques to interpret data. Key Skills Expertise in statistical analysis and datavisualization tools. They play a crucial role in shaping business strategies based on data insights. Key Skills Proficiency in datavisualization tools (e.g.,
Responsibilities of a Data Analyst Data analysts, on the other hand, help businesses and organizations make data-driven decisions through their analytical skills. Their job is mainly to collect, process, analyze, and create detailed reports on data to meet business needs. Basic programming knowledge in R or Python.
In fact, these industries majorly employ Data Scientists. Python, Data Mining, Analytics and ML are one of the most preferred skills for a Data Scientist. Key Skills Need a Mention As a Data Scientist, you should master certain skill sets. Wrapping it up !!!
As MLOps become more relevant to ML demand for strong software architecture skills will increase aswell. Machine Learning As machine learning is one of the most notable disciplines under data science, most employers are looking to build a team to work on ML fundamentals like algorithms, automation, and so on.
This explosive growth is driven by the increasing volume of data generated daily, with estimates suggesting that by 2025, there will be around 181 zettabytes of data created globally. Understanding real-time data processing frameworks, such as Apache Kafka, will also enhance your ability to handle dynamic analytics.
Jupyter Notebooks: Jupyter Notebooks allow users to create and share documents that contain live code, equations, visualizations, and narrative text, making it a popular choice for documenting and sharing time series analysis workflows. Excel: Microsoft Excel can be used for basic time series analysis, especially for small datasets.
Here is the tabular representation of the same: Technical Skills Non-technical Skills Programming Languages: Python, SQL, R Good written and oral communication Data Analysis: Pandas, Matplotlib, Numpy, Seaborn Ability to work in a team ML Algorithms: Regression Classification, Decision Trees, Regression Analysis Problem-solving capability Big Data: (..)
Data Analyst: Data Analysts work with data to extract meaningful insights and support decision-making processes. They gather, clean, analyze, and visualizedata using tools like Excel, SQL, and datavisualization software. Why Pursue a Course in Data Science?
The Power of Machine Learning and AI in Data Science Machine Learning (ML) and AI are integral components of Data Science that enable systems to learn from data without explicit programming. Example: Netflix uses ML to recommend shows based on viewing history.
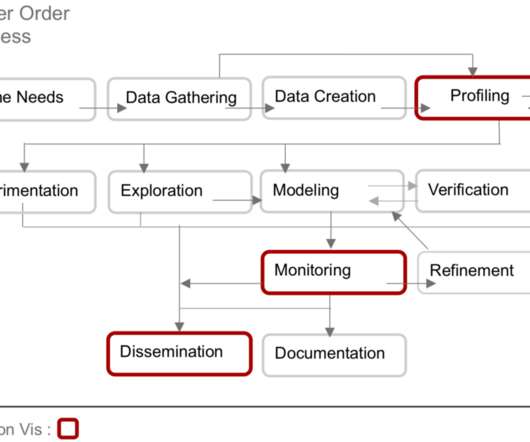
Research Scientist, Tableau. Editor's note: This article originally appeared in the Tableau Engineering Blog. Data science has exploded over the past decade, changing the way that we conduct business and prepare the next generation of young people for the jobs of the future. What is data science? Ana Crisan.
Research Scientist, Tableau. Editor's note: This article originally appeared in the Tableau Engineering Blog. Data science has exploded over the past decade, changing the way that we conduct business and prepare the next generation of young people for the jobs of the future. What is data science? Ana Crisan.
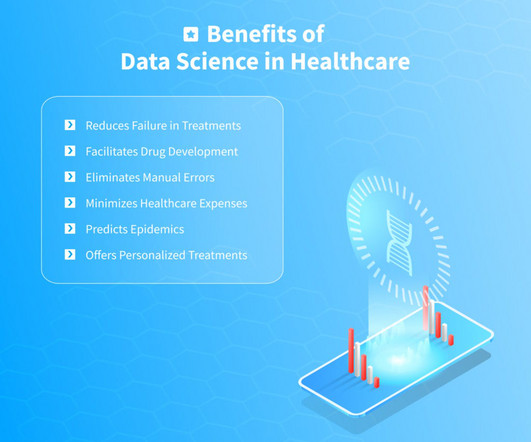
Statistical Analysis System is used to extract data from different sources and visualize it Apache Hadoop is used for processing data across various channels Tableau is used for datavisualization BigML and Rapid Miner are used to generate machine learning algorithms PowerBI is used to create insightful reports and dashboards on healthcare data Trifacta (..)
20212024: Interest declined as deep learning and pre-trained models took over, automating many tasks previously handled by classical ML techniques. This shift suggests that while traditional ML is still relevant, its role is now more supportive rather than cutting-edge.
Runway ML Runway ML is an AI-powered creative suite designed for filmmakers, designers, and artists. Whether removing backgrounds or generating unique visuals, Runway ML streamlines complex multimedia tasks. Its deep reinforcement learning techniques help developers refine game difficulty levels and improve AI opponents.
We organize all of the trending information in your field so you don't have to. Join 17,000+ users and stay up to date on the latest articles your peers are reading.
You know about us, now we want to get to know you!
Let's personalize your content
Let's get even more personalized
We recognize your account from another site in our network, please click 'Send Email' below to continue with verifying your account and setting a password.


Let's personalize your content