
KitikiPlot: Your New Go-To for Time-Series Data Visualization
Analytics Vidhya
DECEMBER 11, 2024
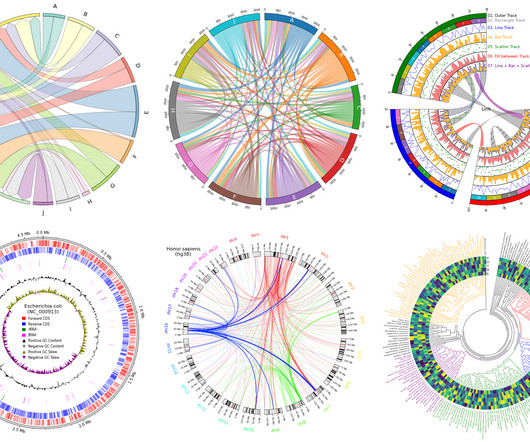
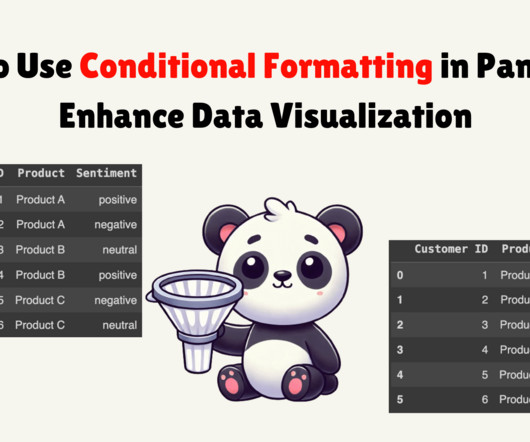
Introducing KitikiPlot, a Python library designed for visualizing sequential and time-series categorical “Sliding Window” patterns.

Analytics Vidhya
DECEMBER 11, 2024
Introducing KitikiPlot, a Python library designed for visualizing sequential and time-series categorical “Sliding Window” patterns.
Analytics Vidhya
MAY 24, 2020
Overview matplotlib is a widely used Python library for performing data visualization and exploratory data analysis These 10 matplotlib tricks will enable you to. The post 10 matplotlib Tricks to Master Data Visualization in Python appeared first on Analytics Vidhya.
This site is protected by reCAPTCHA and the Google Privacy Policy and Terms of Service apply.
Analytics Vidhya
AUGUST 1, 2021
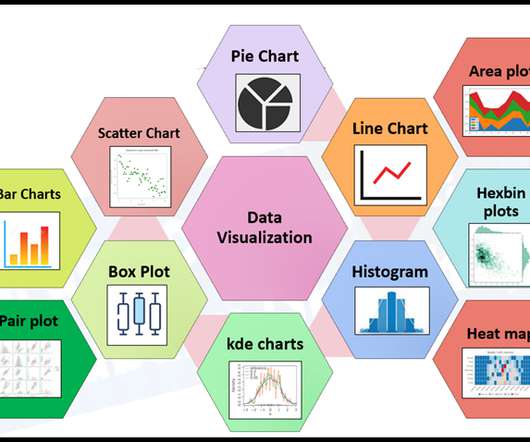
ArticleVideo Book This article was published as a part of the Data Science Blogathon Data Visualization Data Visualization techniques involve the generation of graphical or. The post Effective Data Visualization Techniques in Data Science Using Python appeared first on Analytics Vidhya.

Analytics Vidhya
JULY 26, 2021
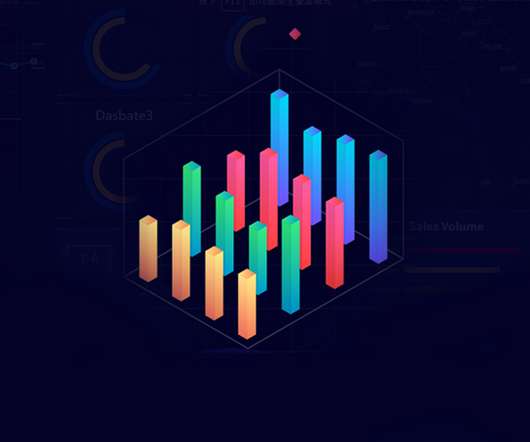
ArticleVideo Book This article was published as a part of the Data Science Blogathon Introduction Visualization leverages the power of data in getting insights and. The post Cyberpunk Themed Charts: Advanced Data Visualization in Python appeared first on Analytics Vidhya.
Analytics Vidhya
MAY 20, 2024
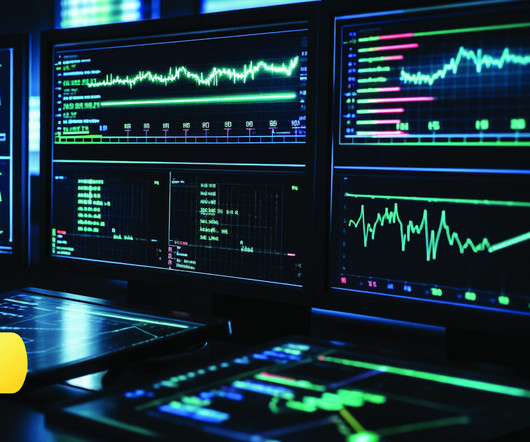
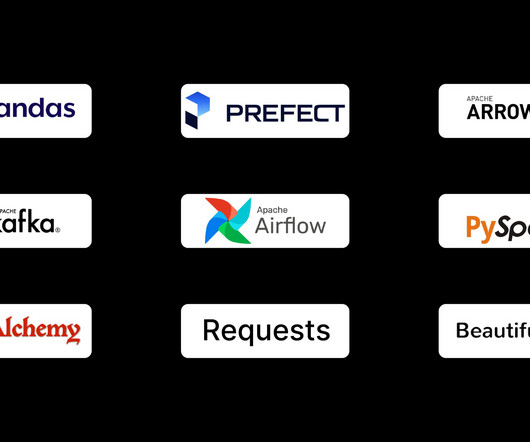
Introduction Strong libraries like Matplotlib, Seaborn, Plotly, and Bokeh serve as the foundation of Python’s data visualization ecosystem. Together, they provide a wide range of tools for trend analysis, results presentation, and the creation of dynamic dashboards.

Analytics Vidhya
JUNE 25, 2021
ArticleVideo Book This article was published as a part of the Data Science Blogathon Introduction Data Visualization helps to bridge the gap between numbers and. The post Plotly and cufflinks : Advanced Python Data Visualization Libraries appeared first on Analytics Vidhya.
KDnuggets
DECEMBER 29, 2022
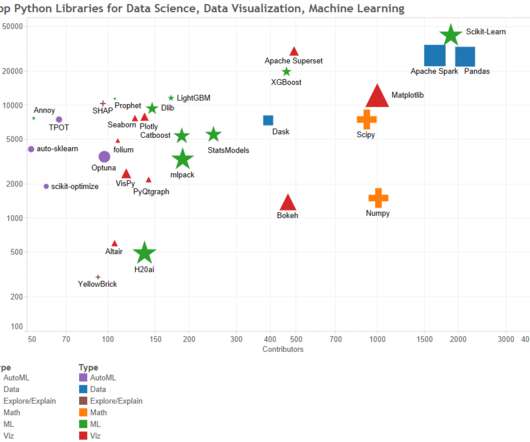
This article compiles the 38 top Python libraries for data science, data visualization & machine learning, as best determined by KDnuggets staff.

Expert insights. Personalized for you.


Let's personalize your content