SQL for Data Visualization: How to Prepare Data for Charts and Graphs
KDnuggets
NOVEMBER 2, 2023
Unlock the Power of SQL in Data Visualization: Master the Art of Preparing Data for Impactful Charts and Graphs.
This site uses cookies to improve your experience. To help us insure we adhere to various privacy regulations, please select your country/region of residence. If you do not select a country, we will assume you are from the United States. Select your Cookie Settings or view our Privacy Policy and Terms of Use.
Cookies and similar technologies are used on this website for proper function of the website, for tracking performance analytics and for marketing purposes. We and some of our third-party providers may use cookie data for various purposes. Please review the cookie settings below and choose your preference.
Used for the proper function of the website
Used for monitoring website traffic and interactions
Cookies and similar technologies are used on this website for proper function of the website, for tracking performance analytics and for marketing purposes. We and some of our third-party providers may use cookie data for various purposes. Please review the cookie settings below and choose your preference.
KDnuggets
NOVEMBER 2, 2023
Unlock the Power of SQL in Data Visualization: Master the Art of Preparing Data for Impactful Charts and Graphs.
KDnuggets
NOVEMBER 8, 2023
This week on KDnuggets: Dive into KDnuggets Back to Basics: Getting Started in 5 Steps series to help you master Python, SQL, Scikit-learn, PyTorch, and Google Cloud Platform. Unlock the Power of SQL in Data Visualization: Master the Art of Preparing Data for Impactful Charts and Graphs. • And much, much more!
This site is protected by reCAPTCHA and the Google Privacy Policy and Terms of Service apply.
Analytics Vidhya
AUGUST 5, 2022
Introduction Most of us are familiar with SQL, and many of us have hands-on experience with it. The post BigQuery: An Walkthrough of ML with Conventional SQL appeared first on Analytics Vidhya. Machine learning is an increasingly popular and developing trend among us.
Analytics Vidhya
JANUARY 26, 2024
In today’s data-driven world, BI platforms like Metabase are essential for extracting insights and facilitating informed decision-making. Discover the power of Metabase in this guide tailored for data professionals.
Analytics Vidhya
JULY 18, 2021
ArticleVideo Book This article was published as a part of the Data Science Blogathon Overview Python Pandas library is becoming most popular between data scientists. The post EDA – Exploratory Data Analysis Using Python Pandas and SQL appeared first on Analytics Vidhya.
Analytics Vidhya
APRIL 28, 2021
ArticleVideo Book This article was published as a part of the Data Science Blogathon. The post Learn how to get insights from Azure SQL Database: A sample data analytics project using Global Peace Index data appeared first on Analytics Vidhya. Introduction Are you passionate about the empirical investigation to find.
Analytics Vidhya
AUGUST 29, 2022
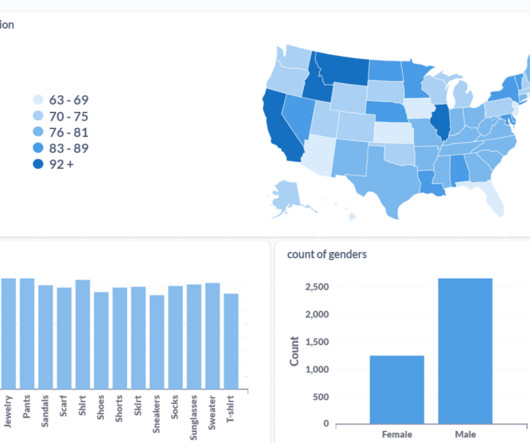
This article was published as a part of the Data Science Blogathon. Introduction Tableau is a data visualization tool created in Salesforce that allows users to connect to any database, like SQL or MongoDB, and interact freely.
Analytics Vidhya
JANUARY 24, 2023
According to Scalegrid’s 2019 database trends report, SQL is the most popular database form, with more than 60% of its use. MySQL is the most common SQL database, while MongoDB […] The post Understanding Neo4j Graph Databases: Purpose and Functionality appeared first on Analytics Vidhya.
Data Science Dojo
OCTOBER 31, 2024
They work closely with database administrators to ensure data integrity, develop reporting tools, and conduct thorough analyses to inform business strategies. Their role is crucial in understanding the underlying data structures and how to leverage them for insights.
Analytics Vidhya
MAY 1, 2022
This article was published as a part of the Data Science Blogathon. Introduction Azure Synapse Analytics is a cloud-based service that combines the capabilities of enterprise data warehousing, big data, data integration, data visualization and dashboarding.
KDnuggets
OCTOBER 9, 2019
Read a comprehensive SQL guide for data analysis; Learn how to choose the right clustering algorithm for your data; Find out how to create a viral DataViz using the data from Data Science Skills poll; Enroll in any of 10 Free Top Notch Natural Language Processing Courses; and more.
NOVEMBER 10, 2023
The blog covers cheat sheets on SQL, statistics, pandas, data visualization, scikit-learn, Git, and theoretical data science concepts.
Data Science Dojo
FEBRUARY 9, 2023
Data is an essential component of any business, and it is the role of a data analyst to make sense of it all. Power BI is a powerful data visualization tool that helps them turn raw data into meaningful insights and actionable decisions. Learn Power BI with this crash course in no time!
KDnuggets
OCTOBER 16, 2019
Also: Kannada-MNIST: A new handwritten digits dataset in ML town; Math for Programmers; The 4 Quadrants of Data Science Skills and 7 Principles for Creating a Viral Data Visualization; The Last SQL Guide for Data Analysis You’ll Ever Need.
Data Science Dojo
AUGUST 27, 2024
Python, R, and SQL: These are the most popular programming languages for data science. Libraries and Tools: Libraries like Pandas, NumPy, Scikit-learn, Matplotlib, Seaborn, and Tableau are like specialized tools for data analysis, visualization, and machine learning.
Data Science Dojo
MAY 10, 2023
Data Analyst Data analysts are responsible for collecting, analyzing, and interpreting large sets of data to identify patterns and trends. They require strong analytical skills, knowledge of statistical analysis, and expertise in data visualization.
Data Science Dojo
MARCH 7, 2023
These skills include programming languages such as Python and R, statistics and probability, machine learning, data visualization, and data modeling. Data preparation is an essential step in the data science workflow, and data scientists should be familiar with various data preparation tools and best practices.
Data Science Dojo
JUNE 7, 2023
The primary aim is to make sense of the vast amounts of data generated daily by combining statistical analysis, programming, and data visualization. It is divided into three primary areas: data preparation, data modeling, and data visualization.
Data Science Dojo
MAY 1, 2023
Pandas Pandas is a powerful data manipulation library for Python that provides fast, flexible, and expressive data structures designed to make working with “relational” or “labeled” data easy and intuitive.
ODSC - Open Data Science
APRIL 6, 2023
Though both are great to learn, what gets left out of the conversation is a simple yet powerful programming language that everyone in the data science world can agree on, SQL. But why is SQL, or Structured Query Language , so important to learn? Let’s start with the first clause often learned by new SQL users, the WHERE clause.
KDnuggets
OCTOBER 14, 2019
Also: Activation maps for deep learning models in a few lines of code; The 4 Quadrants of Data Science Skills and 7 Principles for Creating a Viral Data Visualization; OpenAI Tried to Train AI Agents to Play Hide-And-Seek but Instead They Were Shocked by What They Learned; 10 Great Python Resources for Aspiring Data Scientists.
Data Science Dojo
MAY 18, 2023
Data Storytelling in Action: This panel will discuss the importance of data visualization in storytelling in different industries, different visualization tools, tips on improving one’s visualization skills, personal experiences, breakthroughs, pressures, and frustrations as well as successes and failures.
Data Science Dojo
APRIL 18, 2023
Skills for data analysts 2023 10 essential skills for data analysts to have in 2023 Here are 10 essential skills for data analysts to have in 2023: 1. Data Visualization: Topping the list of skills for data analysts data visualization stands first.
Data Science Dojo
AUGUST 27, 2024
Python, R, and SQL: These are the most popular programming languages for data science. Libraries and Tools: Libraries like Pandas, NumPy, Scikit-learn, Matplotlib, Seaborn, and Tableau are like specialized tools for data analysis, visualization, and machine learning.
Data Science Dojo
JULY 6, 2023
Data engineering tools offer a range of features and functionalities, including data integration, data transformation, data quality management, workflow orchestration, and data visualization. Essential data engineering tools for 2023 Top 10 data engineering tools to watch out for in 2023 1.
Dataconomy
JULY 24, 2023
” Data management and manipulation Data scientists often deal with vast amounts of data, so it’s crucial to understand databases, data architecture, and query languages like SQL. Skills in manipulating and managing data are also necessary to prepare the data for analysis.
Data Science Dojo
MAY 1, 2023
Pandas Pandas is a powerful data manipulation library for Python that provides fast, flexible, and expressive data structures designed to make working with “relational” or “labeled” data easy and intuitive.
ODSC - Open Data Science
NOVEMBER 3, 2023
Data visualization tools turn insights and data into something understandable, especially for non-data stakeholders who may not share the same skillsets as the team who’s behind the data. So let’s take a look at seven trending data visualization tools that have gotten quite a bit of attention on GitHub this year.
Data Science Dojo
JULY 3, 2024
Data science bootcamps are intensive short-term educational programs designed to equip individuals with the skills needed to enter or advance in the field of data science. They cover a wide range of topics, ranging from Python, R, and statistics to machine learning and data visualization.
Smart Data Collective
APRIL 14, 2021
If you occasionally run business stands in fairs, congresses and exhibitions, business stands designers can incorporate business intelligence to aid in better business and client data collection. Business intelligence tools can include data warehousing, data visualizations, dashboards, and reporting.
ODSC - Open Data Science
FEBRUARY 24, 2023
While machine learning frameworks and platforms like PyTorch, TensorFlow, and scikit-learn can perform data exploration well, it’s not their primary intent. There are also plenty of data visualization libraries available that can handle exploration like Plotly, matplotlib, D3, Apache ECharts, Bokeh, etc.
Pickl AI
JULY 3, 2024
Summary: Master SQL ranking functions to analyze data order and uncover trends. Introduction to SQL Ranking In the realm of Data Analysis, extracting insights often goes beyond simple aggregations. Introduction to SQL Ranking In the realm of Data Analysis, extracting insights often goes beyond simple aggregations.
Data Science Dojo
OCTOBER 4, 2024
Key Skills Required Knowledge of Algorithms and Predictive Models: Proficiency in using algorithms and predictive models to forecast future trends based on present data. Data Visualization Techniques: Ability to transform complex data into understandable graphs and charts.
ODSC - Open Data Science
FEBRUARY 2, 2023
This doesn’t mean anything too complicated, but could range from basic Excel work to more advanced reporting to be used for data visualization later on. Computer Science and Computer Engineering Similar to knowing statistics and math, a data scientist should know the fundamentals of computer science as well.
AWS Machine Learning Blog
DECEMBER 11, 2024
With an Amazon Q custom plugin that uses an internal library used for natural language to SQL (NL2SQL), the same that powers generative SQL capabilities across some AWS database services like Amazon Redshift, we will provide the ability to aggregate and slice-and-dice the opportunity pipeline and trends in product consumption conversationally.
Smart Data Collective
SEPTEMBER 21, 2020
Generally derived from conventional SQL databases, graph databases convert SQL information using GraphQL and allow users to better visualize relationships between individual data points.
Smart Data Collective
SEPTEMBER 26, 2021
You can finally understand what you’re looking at and what the data is saying. The format can be classified by size, but you can choose to organize data horizontally or vertically/by column. It doesn’t matter if you use graphs or charts, you need to get better at data visualization. Speaking of which.
Dataconomy
MAY 16, 2023
They employ statistical and mathematical techniques to uncover patterns, trends, and relationships within the data. Data scientists possess a deep understanding of statistical modeling, data visualization, and exploratory data analysis to derive actionable insights and drive business decisions.
Dataconomy
JUNE 1, 2023
Unified data storage : Fabric’s centralized data lake, Microsoft OneLake, eliminates data silos and provides a unified storage system, simplifying data access and retrieval.
Data Science Dojo
SEPTEMBER 11, 2024
In the sales context, this helps monitor sales data in Power BI reports and trigger alerts or actions based on real-time changes, ensuring that sales teams can respond quickly to critical events. This enables a deep analysis of sales data, helping to identify what drives demand and what affects sales performance.
Pickl AI
MARCH 3, 2025
Summary: Business Intelligence Analysts transform raw data into actionable insights. They use tools and techniques to analyse data, create reports, and support strategic decisions. Key skills include SQL, data visualization, and business acumen. Introduction We are living in an era defined by data.
Data Science 101
MAY 6, 2019
I think in physics one of the things that attracted me most to the field that I studied, which was particle physics, was the ability to leverage computer science mathematical modeling and data visualization to solve big questions. He asks, “How important is SQL in comparison to Python in 2019?”. However, you have to know SQL.
Analytics Vidhya
MAY 21, 2023
Introduction Not a single day passes without us getting to hear the word “data.” This is precisely what happens in data analytics. People equipped with the […] The post 10 Best Data Analytics Projects appeared first on Analytics Vidhya. It is almost as if our lives revolve around it. Don’t they?
Mlearning.ai
APRIL 29, 2023
Submission Suggestions 8-Week SQL Challenge: Data Bank was originally published in MLearning.ai You’d love to interact with the dashboard here. And feel free to say hi on Linkedin and connect with me on Twitter. ?? BECOME a WRITER at MLearning.ai
Expert insights. Personalized for you.
We have resent the email to
Are you sure you want to cancel your subscriptions?
Let's personalize your content