This site uses cookies to improve your experience. To help us insure we adhere to various privacy regulations, please select your country/region of residence. If you do not select a country, we will assume you are from the United States. Select your Cookie Settings or view our Privacy Policy and Terms of Use.
Cookie Settings
Cookies and similar technologies are used on this website for proper function of the website, for tracking performance analytics and for marketing purposes. We and some of our third-party providers may use cookie data for various purposes. Please review the cookie settings below and choose your preference.
Used for the proper function of the website
Used for monitoring website traffic and interactions
Cookie Settings
Cookies and similar technologies are used on this website for proper function of the website, for tracking performance analytics and for marketing purposes. We and some of our third-party providers may use cookie data for various purposes. Please review the cookie settings below and choose your preference.
Strictly Necessary: Used for the proper function of the website
Performance/Analytics: Used for monitoring website traffic and interactions
Enter AnalyticsCreator AnalyticsCreator, a powerful tool for data management, brings a new level of efficiency and reliability to the CI/CD process. It offers full BI-Stack Automation, from source to datawarehouse through to frontend. Data Lakes : It supports MS Azure Blob Storage.
When thinking about PowerBI , the platform’s visuals and report side immediately come to mind. While the front-end report visuals are important and the most visible to end users, a lot goes on behind the scenes that contribute heavily to the end product, including data modeling. Why Does Data Modeling Matter in PowerBI?
How to Optimize PowerBI and Snowflake for Advanced Analytics Spencer Baucke May 25, 2023 The world of business intelligence and data modernization has never been more competitive than it is today. Table of Contents Why Discuss Snowflake & PowerBI?
Microsoft Fabric combines multiple elements into a single platform – Image courtesy of Microsoft The contribution of PowerBI The integration of Microsoft PowerBI and Microsoft Fabric offers a powerful combination for organizations seeking comprehensive data analytics and insights.
The Datamarts capability opens endless possibilities for organizations to achieve their data analytics goals on the PowerBI platform. Before we look into the PowerBI Datamarts, let us take a step back and understand the meaning of a Datamart. in an enterprise datawarehouse.
In a perfect scenario, everything a data analyst would need to answer business users’ questions would live in cleaned, curated, and modeled tables in a datawarehouse. The analyst could connect to the datawarehouse and start developing reports. M is the formula language behind the scenes of Power Query.
Open source business intelligence software provides a cost-effective and flexible way for businesses to access and analyze their data. Data visualization: Open source BI software offers a range of visualization options, including charts, graphs, and dashboards, to help businesses understand their data and make informed decisions.
Microsoft PowerBI. Microsoft PowerBI is a free and powerful business intelligence tool from a world-leading software giant Microsoft. This BI tool allows you to get data and insights in minutes with your smartphone, tablet or laptop. It can analyze practically any size of data.
The modern data stack is a combination of various software tools used to collect, process, and store data on a well-integrated cloud-based data platform. It is known to have benefits in handling data due to its robustness, speed, and scalability. A typical modern data stack consists of the following: A datawarehouse.
In the 1970s, data was confined to mainframes and primitive databases. Reports required a formal request of the few who could access that data. The 1980s ushered in the antithesis of this version of computing — personal computing and distributed database management — but also introduced duplicated data and enterprise data silos.
To pursue a data science career, you need a deep understanding and expansive knowledge of machine learning and AI. And you should have experience working with big data platforms such as Hadoop or Apache Spark. Data scientists will typically perform data analytics when collecting, cleaning and evaluating data.
These tools enable organizations to convert raw data into actionable insights through various means such as reporting, analytics, data visualization, and performance management. Data Processing: Cleaning and organizing data for analysis.
Essentially, BI bridges the gap between raw data and actionable knowledge. It gathers information from various sources sales databases, marketing platforms, customer feedback, and more and consolidates it into a unified view. Ensuring data accuracy and consistency through cleansing and validation processes.
Here are steps you can follow to pursue a career as a BI Developer: Acquire a solid foundation in data and analytics: Start by building a strong understanding of data concepts, relational databases, SQL (Structured Query Language), and data modeling.
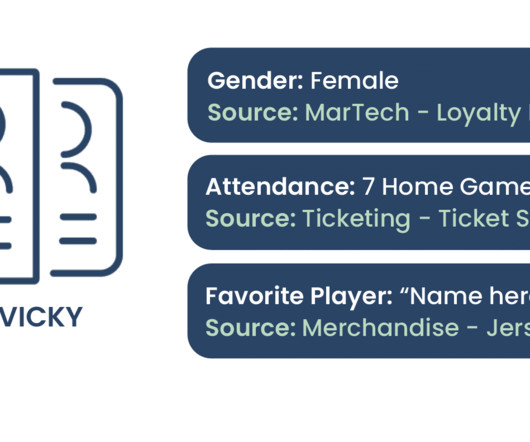
They encompass all the origins from which data is collected, including: Internal Data Sources: These include databases, enterprise resource planning (ERP) systems, customer relationship management (CRM) systems, and flat files within an organization. Data can be structured (e.g., databases), semi-structured (e.g.,
Snowflake’s built-for-the-cloud architecture is highly performant and designed to handle large volumes of data and data consumers. Because of its cloud architecture, users do not have to worry about the maintenance of the infrastructure and the database going down at an inopportune time.
Some of the common career opportunities in BI include: Entry-level roles Data analyst: A data analyst is responsible for collecting and analyzing data, creating reports, and presenting insights to stakeholders. They may also be involved in data modeling and database design.
Some of the common career opportunities in BI include: Entry-level roles Data analyst: A data analyst is responsible for collecting and analyzing data, creating reports, and presenting insights to stakeholders. They may also be involved in data modeling and database design.
Velocity It indicates the speed at which data is generated and processed, necessitating real-time analytics capabilities. Businesses need to analyse data as it streams in to make timely decisions. This diversity requires flexible data processing and storage solutions. js for creating interactive visualisations.
Retail Sales In a retail datawarehouse , the sales fact table might include metrics such as sales revenue, units sold, discounts applied, and profit margins. Web Analytics In a web analytics datawarehouse, the page views fact table might include metrics such as total page views, unique visitors, session duration, and bounce rate.
Data engineers are essential professionals responsible for designing, constructing, and maintaining an organization’s data infrastructure. They create data pipelines, ETL processes, and databases to facilitate smooth data flow and storage. Data Warehousing: Amazon Redshift, Google BigQuery, etc.
Real-world Examples To illustrate the practical applications of hierarchies in dimensional modelling, this section explores real-world examples across various industries, showcasing how hierarchies enhance data organisation, analysis, and decision-making.
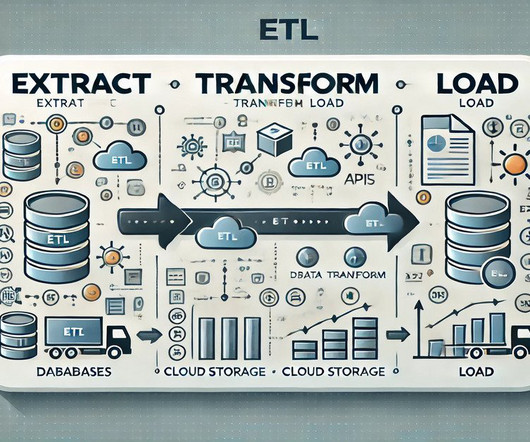
ETL (Extract, Transform, Load) is a core process in data integration that involves extracting data from various sources, transforming it into a usable format, and loading it into a target system, such as a datawarehouse. Data Sources : Evaluate the types and number of data sources you must connect to.
SQL stands for Structured Query Language, essential for querying and manipulating data stored in relational databases. The SELECT statement retrieves data from a database, while SELECT DISTINCT eliminates duplicate rows from the result set. Have you worked with cloud-based data platforms like AWS, Google Cloud, or Azure?
Their tasks encompass: Data Collection and Extraction Identify relevant data sources and gather data from various internal and external systems Extract, transform, and load data into a centralized datawarehouse or analytics platform Data Cleaning and Preparation Cleanse and standardize data to ensure accuracy, consistency, and completeness.
Azure Synapse Analytics Previously known as Azure SQL DataWarehouse , Azure Synapse Analytics offers a limitless analytics service that combines big data and data warehousing. This service enables Data Scientists to query data on their terms using serverless or provisioned resources at scale.
There is a plethora of BI tools available in the market today, with new ones being added yearly. Through a comparative analysis of some of the leading BI tools: Google Looker, Microsoft PowerBI, Tableau and Qlik Sense, discover which BI solution best fits your organization’s data analytics needs to empower informed decision-making.
Without data engineering , companies would struggle to analyse information and make informed decisions. What Does a Data Engineer Do? A data engineer creates and manages the pipelines that transfer data from different sources to databases or cloud storage. How is Data Engineering Different from Data Science?
We organize all of the trending information in your field so you don't have to. Join 17,000+ users and stay up to date on the latest articles your peers are reading.
You know about us, now we want to get to know you!
Let's personalize your content
Let's get even more personalized
We recognize your account from another site in our network, please click 'Send Email' below to continue with verifying your account and setting a password.


Let's personalize your content