This site uses cookies to improve your experience. To help us insure we adhere to various privacy regulations, please select your country/region of residence. If you do not select a country, we will assume you are from the United States. Select your Cookie Settings or view our Privacy Policy and Terms of Use.
Cookie Settings
Cookies and similar technologies are used on this website for proper function of the website, for tracking performance analytics and for marketing purposes. We and some of our third-party providers may use cookie data for various purposes. Please review the cookie settings below and choose your preference.
Used for the proper function of the website
Used for monitoring website traffic and interactions
Cookie Settings
Cookies and similar technologies are used on this website for proper function of the website, for tracking performance analytics and for marketing purposes. We and some of our third-party providers may use cookie data for various purposes. Please review the cookie settings below and choose your preference.
Strictly Necessary: Used for the proper function of the website
Performance/Analytics: Used for monitoring website traffic and interactions
These experiences facilitate professionals from ingesting data from different sources into a unified environment and pipelining the ingestion, transformation, and processing of data to developing predictive models and analyzing the data by visualization in interactive BI reports. Choose a visual of interest.
When thinking about PowerBI , the platform’s visuals and report side immediately come to mind. While the front-end report visuals are important and the most visible to end users, a lot goes on behind the scenes that contribute heavily to the end product, including data modeling. What is Data Modeling?
Microsoft Fabric combines multiple elements into a single platform – Image courtesy of Microsoft The contribution of PowerBI The integration of Microsoft PowerBI and Microsoft Fabric offers a powerful combination for organizations seeking comprehensive data analytics and insights.
Google BigQuery When it comes to cloud datawarehouses, Snowflake, Amazon Redshift, and Google BigQuery are often at the forefront of discussions. Each platform offers unique features and benefits, making it vital for data engineers to understand their differences. Interested in attending an ODSC event?
To pursue a data science career, you need a deep understanding and expansive knowledge of machine learning and AI. Diagnostic analytics: Diagnostic analytics helps pinpoint the reason an event occurred. Watsonx comprises of three powerful components: the watsonx.ai
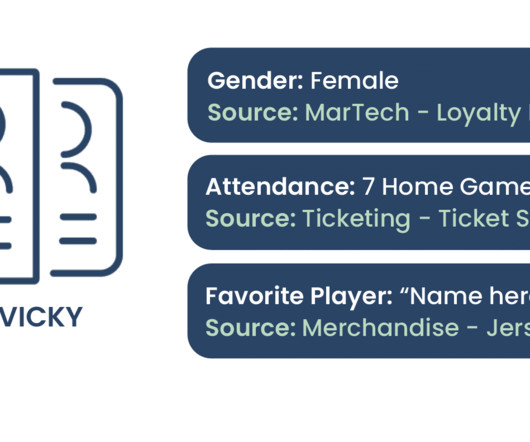
Step 2: Analyze the Data Once you have centralized your data, use a business intelligence tool like Sigma Computing , PowerBI , Tableau , or another to craft analytics dashboards. We are going to break down what we know about Victory Vicky based on all the data sources we have moved into our datawarehouse.
They may also be involved in data modeling and database design. BI developer: A BI developer is responsible for designing and implementing BI solutions, including datawarehouses, ETL processes, and reports. They may also be involved in data integration and data quality assurance.
They may also be involved in data modeling and database design. BI developer: A BI developer is responsible for designing and implementing BI solutions, including datawarehouses, ETL processes, and reports. They may also be involved in data integration and data quality assurance.
KPIs for predictive maintenance include: Equipment downtime Mean time between failures (MTBF) Mean time to repair (MTTR) All of these KPIs can be measured by tracking the amount of time that equipment is not in use due to maintenance or repair, as well as the frequency and duration of maintenance and repair events.
These tables are called “factless fact tables” or “junction tables” They are used for modelling many-to-many relationships or for capturing timestamps of events. Dealing with Sparse Data In some cases, fact tables may contain a large number of null values due to missing data.
Data Warehousing Solutions Tools like Amazon Redshift, Google BigQuery, and Snowflake enable organisations to store and analyse large volumes of data efficiently. Students should learn about the architecture of datawarehouses and how they differ from traditional databases. js for creating interactive visualisations.
Azure Synapse Analytics Previously known as Azure SQL DataWarehouse , Azure Synapse Analytics offers a limitless analytics service that combines big data and data warehousing. This service enables Data Scientists to query data on their terms using serverless or provisioned resources at scale.
Vor einen Jahrzehnt war es immer noch recht üblich, sich einfach ein BI Tool zu nehmen, sowas wie QlikView, Tableau oder PowerBI, mittlerweile gibt es ja noch einige mehr, und da direkt die Daten reinzuladen und dann halt loszulegen mit dem Aufbau der Reports. Ein DataWarehouse ist eine oder eine Menge von Datenbanken.
Der andere Teil des Process Minings ist jedoch noch viel wesentlicher, denn es handelt sich dabei um das Fundament der Analyse: Die Datenmodellierung des Event Logs. Jedes Process Mining Tool benötigt pro Use Case mindestens ein Event Log. Idealerweise werden nur fertige Event-Logs bzw. Celonis Process Mining) übertragen.
Process Mining wurde kürzlich in die Power Automate Plattform und in PowerBI integriert. Process Mining Tools, die Business Intelligence Software erweitern Und dann gibt es noch diejenigen Anbieter, die bestehende BI Tools mit Erweiterungen zum Process Mining Analysewerkzeug machen. nicht mehr weiterentwickelt wird.
Apache Kafka Apache Kafka is a distributed event streaming platform used for real-time data processing. It helps data engineers collect, store, and process streams of records in a fault-tolerant way, making it crucial for building reliable data pipelines.
We organize all of the trending information in your field so you don't have to. Join 17,000+ users and stay up to date on the latest articles your peers are reading.
You know about us, now we want to get to know you!
Let's personalize your content
Let's get even more personalized
We recognize your account from another site in our network, please click 'Send Email' below to continue with verifying your account and setting a password.


Let's personalize your content