This site uses cookies to improve your experience. To help us insure we adhere to various privacy regulations, please select your country/region of residence. If you do not select a country, we will assume you are from the United States. Select your Cookie Settings or view our Privacy Policy and Terms of Use.
Cookie Settings
Cookies and similar technologies are used on this website for proper function of the website, for tracking performance analytics and for marketing purposes. We and some of our third-party providers may use cookie data for various purposes. Please review the cookie settings below and choose your preference.
Used for the proper function of the website
Used for monitoring website traffic and interactions
Cookie Settings
Cookies and similar technologies are used on this website for proper function of the website, for tracking performance analytics and for marketing purposes. We and some of our third-party providers may use cookie data for various purposes. Please review the cookie settings below and choose your preference.
Strictly Necessary: Used for the proper function of the website
Performance/Analytics: Used for monitoring website traffic and interactions
Introduction Tableau is a data visualization tool created in Salesforce that allows users to connect to any database, like SQL or MongoDB, and interact freely. The post Most Frequently Asked Tableau Interview Questions appeared first on Analytics Vidhya.
Database Analyst Description Database Analysts focus on managing, analyzing, and optimizing data to support decision-making processes within an organization. They work closely with database administrators to ensure data integrity, develop reporting tools, and conduct thorough analyses to inform business strategies.
It also supports a wide range of data warehouses, analytical databases, data lakes, frontends, and pipelines/ETL. This includes the creation of SQL Code, DACPAC files, SSIS packages, Data Factory ARM templates, and XMLA files. Frontends : AnalyticsCreator supports Power BI, Qlik Sense, Tableau, PowerPivot (Excel).
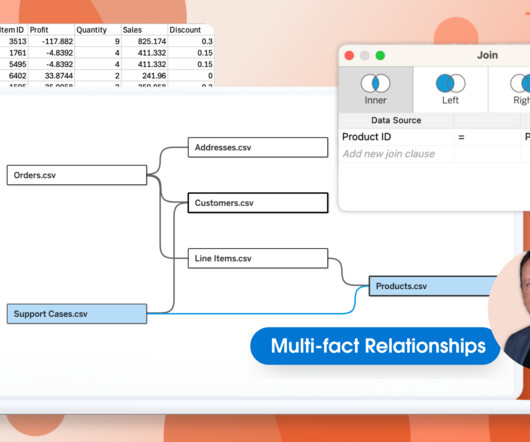
Spencer Czapiewski August 29, 2024 - 9:52pm Kirk Munroe Chief Analytics Officer & Founding Partner at Paint with Data Kirk Munroe, Chief Analytics Officer and Founding Partner at Paint with Data and Tableau DataDev Ambassador, explains the value of using relationships in your Tableau data models. How can this be possible?
Technical Fellow, Tableau. Tableau has been helping people and organizations to see and understand data for almost two decades, bringing exciting innovations to the landscape of business intelligence with every product release. I am proud to announce that my History of Tableau Innovation viz is now published to Tableau Public.
In Tableau 2021.1, we’ve added new connectors to help our customers access more data in Azure than ever before: an Azure SQLDatabase connector and an Azure Data Lake Storage Gen2 connector. Azure SQLDatabase. Many customers rely on Azure SQLDatabase as a managed, cloud-hosted version of SQL Server.
Chief Product Officer, Tableau. Tableau and Google Cloud are partnering to help modernize your data and analytics infrastructure and unlock your data’s full value. With Tableau, any user can visually explore that data in real time. Governed, self-service with Tableau and Looker. Francois Ajenstat. Spencer Czapiewski.
Madeleine Corneli Senior Manager, Product Management, Tableau Adiascar Cisneros Manager, Product Management, Tableau Bronwen Boyd April 3, 2023 - 5:27pm April 3, 2023 Google Cloud’s BigQuery is a serverless, highly-scalable cloud-based data warehouse solution that allows users to store, query, and analyze large datasets quickly.
Product Marketing Specialist, Tableau. The newest release of Tableau is here! Tableau 2021.1 Upgrade to take advantage of these new innovations, and learn more about how Tableau brings AI into analytics to help users across your organization answer pressing questions. In Tableau 2021.1, In Tableau 2021.1,
Technical Fellow, Tableau. Tableau has been helping people and organizations to see and understand data for almost two decades, bringing exciting innovations to the landscape of business intelligence with every product release. I am proud to announce that my History of Tableau Innovation viz is now published to Tableau Public.
Kuber Sharma Director, Product Marketing, Tableau Kristin Adderson August 22, 2023 - 12:11am August 22, 2023 Whether you're a novice data analyst exploring the possibilities of Tableau or a leader with years of experience using VizQL to gain advanced insights—this is your list of key Tableau features you should know, from A to Z.
Though both are great to learn, what gets left out of the conversation is a simple yet powerful programming language that everyone in the data science world can agree on, SQL. But why is SQL, or Structured Query Language , so important to learn? Let’s start with the first clause often learned by new SQL users, the WHERE clause.
Chief Product Officer, Tableau. Tableau and Google Cloud are partnering to help modernize your data and analytics infrastructure and unlock your data’s full value. With Tableau, any user can visually explore that data in real time. Governed, self-service with Tableau and Looker. Francois Ajenstat. Spencer Czapiewski.
In Tableau 2021.1, we’ve added new connectors to help our customers access more data in Azure than ever before: an Azure SQLDatabase connector and an Azure Data Lake Storage Gen2 connector. Azure SQLDatabase. Many customers rely on Azure SQLDatabase as a managed, cloud-hosted version of SQL Server.
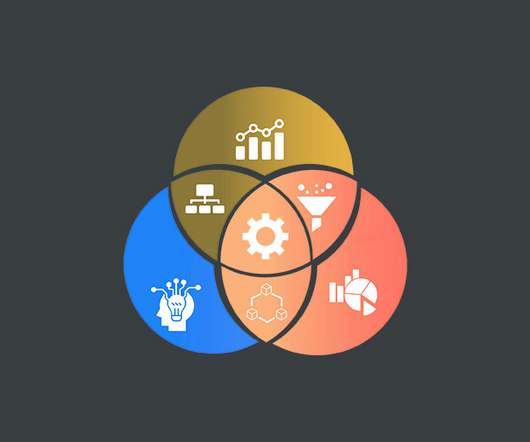
Summary: Tableau simplifies data visualisation with interactive dashboards, AI-driven insights, and seamless data integration. With mapping features, customisable charts, and automated analytics, Tableau enhances data-driven strategies, helping businesses extract valuable insights for better decision-making and operational efficiency.
The database for Process Mining is also establishing itself as an important hub for Data Science and AI applications, as process traces are very granular and informative about what is really going on in the business processes. This aspect can be applied well to Process Mining, hand in hand with BI and AI.
The easiest skill that a Data Science aspirant might develop is SQL. Management and storage of Data in businesses require the use of a Database Management System. This blog would an introduction to SQL for Data Science which would cover important aspects of SQL, its need in Data Science, and features and applications of SQL.
That is why we continue to develop Alation Anywhere, a way to surface rich contextual information like business term definitions and database table previews from Alation to a suite of third-party tools. This could be anything from a business glossary term, to a table in a database, or a SQL query someone has published and described.
Madeleine Corneli Senior Manager, Product Management, Tableau Adiascar Cisneros Manager, Product Management, Tableau Bronwen Boyd April 3, 2023 - 5:27pm April 3, 2023 Google Cloud’s BigQuery is a serverless, highly-scalable cloud-based data warehouse solution that allows users to store, query, and analyze large datasets quickly.
Summary: Data Blending in Tableau is helpful in deriving multiple sources to gain comprehensive insights. Through intuitive drag-and-drop functionality, Tableau enables users to blend disparate datasets effortlessly, facilitating holistic data exploration. What is Data Blending in tableau with an example?
SQL or Structured Query Language has a significant role to play in conducting practical Data Analysis. That’s where SQL comes in, enabling data analysts to extract, manipulate and analyse data from multiple sources. That’s where SQL comes in, enabling data analysts to extract, manipulate and analyse data from multiple sources.
Tableau is a data visualisation software helping you to generate graphics-rich reporting and analysing enormous volumes of data. With the help of Tableau, organisations have been able to mine and gather actionable insights from granular sources of data. But What is Tableau for Data Science and what are its advantages and disadvantages?
In this post, we describe how CBRE partnered with AWS Prototyping to develop a custom query environment allowing natural language query (NLQ) prompts by using Amazon Bedrock, AWS Lambda , Amazon Relational Database Service (Amazon RDS), and Amazon OpenSearch Service. The wrapper function runs the SQL query using psycopg2.
Product Marketing Specialist, Tableau. The newest release of Tableau is here! Tableau 2021.1 Upgrade to take advantage of these new innovations, and learn more about how Tableau brings AI into analytics to help users across your organization answer pressing questions. In Tableau 2021.1, In Tableau 2021.1,
Summary: Data Visualisation is crucial to ensure effective representation of insights tableau vs power bi are two popular tools for this. This article compares Tableau and Power BI, examining their features, pricing, and suitability for different organisations. What is Tableau? billion in 2023. from 2022 to 2028.
Tools like Tableau, Power BI, and Python libraries such as Matplotlib and Seaborn are commonly taught. Databases and SQL : Managing and querying relational databases using SQL, as well as working with NoSQL databases like MongoDB. R : Often used for statistical analysis and data visualization.
One of the biggest benefits of Tableau is that the software is free and extremely versatile. It works with a number of different databases. With that said, a basic understanding of SQL and VB Script can be helpful in leveraging all it has to offer. So, what are the best analytics tools for businesses in 2021? RapidMiner.
Overview There are a plethora of data science tools out there – which one should you pick up? Here’s a list of over 20. The post 22 Widely Used Data Science and Machine Learning Tools in 2020 appeared first on Analytics Vidhya.
” Data management and manipulation Data scientists often deal with vast amounts of data, so it’s crucial to understand databases, data architecture, and query languages like SQL. Tools like Tableau, Matplotlib, Seaborn, or Power BI can be incredibly helpful. This is where data visualization comes in.
There are many well-known libraries and platforms for data analysis such as Pandas and Tableau, in addition to analytical databases like ClickHouse, MariaDB, Apache Druid, Apache Pinot, Google BigQuery, Amazon RedShift, etc. VisiData works with CSV files, Excel spreadsheets, SQLdatabases, and many other data sources.
With the help of SQL and R, this tool analyzes your data and turns it into pretty interactive dashboards within minutes. You can add time-based and custom filters, write SQL, get charts, and share dashboards with the team. Its analytics can integrate with different SQLdatabases and different data warehouses.
Programming languages such as SQL and Python enable data analysts to get more out of data within the business, by delving into the complexities of large databases and providing actionable insights. From a database analyst to a business analyst or data scientist, you never know where the next opportunity may be available.
Key skills include SQL, data visualization, and business acumen. Essential skills include SQL, data visualization, and strong analytical abilities. It gathers information from various sources sales databases, marketing platforms, customer feedback, and more and consolidates it into a unified view.
Through a comparative analysis of some of the leading BI tools: Google Looker, Microsoft Power BI, Tableau and Qlik Sense, discover which BI solution best fits your organization’s data analytics needs to empower informed decision-making. Examples include SQl, DWH, and Cloud based systems (Google Bigquery).
Ryan Cairnes Senior Manager, Product Management, Tableau Hannah Kuffner July 28, 2020 - 10:43pm March 20, 2023 Tableau Prep is a citizen data preparation tool that brings analytics to anyone, anywhere. These tips can be used in any of your Prep flows but will have the most impact on your flows that connect to large database tables.
Ryan Cairnes Senior Manager, Product Management, Tableau Hannah Kuffner July 28, 2020 - 10:43pm March 20, 2023 Tableau Prep is a citizen data preparation tool that brings analytics to anyone, anywhere. These tips can be used in any of your Prep flows but will have the most impact on your flows that connect to large database tables.
Without proper databases or other infrastructure like analytics tools that are conducive to your team members gaining data insights, your goal of a data-driven workplace can quickly become a pipedream. Set Up The Right Infrastructure. Start simple and expand it from there. Use Data To Drive Meaningful Change.
Here are steps you can follow to pursue a career as a BI Developer: Acquire a solid foundation in data and analytics: Start by building a strong understanding of data concepts, relational databases, SQL (Structured Query Language), and data modeling.
Data Wrangling: Data Quality, ETL, Databases, Big Data The modern data analyst is expected to be able to source and retrieve their own data for analysis. Competence in data quality, databases, and ETL (Extract, Transform, Load) are essential. SQL excels with big data and statistics, making it important in order to query databases.
Summary: Power BI alternatives like Tableau, Qlik Sense, and Zoho Analytics provide businesses with tailored Data Analysis and Visualisation solutions. Key Takeaways Tools like Tableau, Qlik Sense, and Metabase offer distinct strengths for various business needs. Many alternatives provide intuitive interfaces for non-technical users.
They create data pipelines, ETL processes, and databases to facilitate smooth data flow and storage. With expertise in programming languages like Python , Java , SQL, and knowledge of big data technologies like Hadoop and Spark, data engineers optimize pipelines for data scientists and analysts to access valuable insights efficiently.
More on this topic later; but for now, keep in mind that the simplest method is to create a naming convention for database objects that allows you to identify the owner and associated budget. You can set this value for each database and choose to have non-production data stored for fewer days. authorization server.
Whether you want nodes to publish your data to Tableau Server, connect to a Snowflake Data Cloud database , or perform image or audio analyses, there is an extension for you. If you need to connect to a database for any purpose, this extension cannot be ignored. These include Microsoft SQL Server, MySQL, Oracle, and PostgreSQL.
Figure 1: Magic Quadrant Cloud Database Systems Source: Gartner (December 2021) Power BI is a data visualization and analysis tool that is one of the four tools within Microsoft’s Power Platform. The June 2021 release of Power BI Desktop introduced Custom SQL queries to Snowflake in DirectQuery mode.
We organize all of the trending information in your field so you don't have to. Join 17,000+ users and stay up to date on the latest articles your peers are reading.
You know about us, now we want to get to know you!
Let's personalize your content
Let's get even more personalized
We recognize your account from another site in our network, please click 'Send Email' below to continue with verifying your account and setting a password.


Let's personalize your content