This site uses cookies to improve your experience. To help us insure we adhere to various privacy regulations, please select your country/region of residence. If you do not select a country, we will assume you are from the United States. Select your Cookie Settings or view our Privacy Policy and Terms of Use.
Cookie Settings
Cookies and similar technologies are used on this website for proper function of the website, for tracking performance analytics and for marketing purposes. We and some of our third-party providers may use cookie data for various purposes. Please review the cookie settings below and choose your preference.
Used for the proper function of the website
Used for monitoring website traffic and interactions
Cookie Settings
Cookies and similar technologies are used on this website for proper function of the website, for tracking performance analytics and for marketing purposes. We and some of our third-party providers may use cookie data for various purposes. Please review the cookie settings below and choose your preference.
Strictly Necessary: Used for the proper function of the website
Performance/Analytics: Used for monitoring website traffic and interactions
PowerBI Desktop is a wonderful business intelligence tool that has an expansive list of reporting capabilities, but there is one thing that you aren’t able to do with it – create a paginated report, which is a specific style of report that is designed to be exported or printed. What Is PowerBI Report Builder?
Defining the Problem The starting point for any successful data workflow is problem definition. In PowerBI, you can merge these sources through data transformation, while in Python, libraries like pandas are used to integrate and join different datasets.
How to Optimize PowerBI and Snowflake for Advanced Analytics Spencer Baucke May 25, 2023 The world of business intelligence and data modernization has never been more competitive than it is today. Table of Contents Why Discuss Snowflake & PowerBI?
When making changes to a PowerBI Dataset, you can have a similar experience. When making changes to large, complex datasets, you can either republish entire Datasets or modify the existing dataset and push only the differences up to the PowerBI Service. What is the ALM Toolkit, and Why Does it Matter?
They’ve tried to do this with the existing report created with PowerBI Desktop, and they can only see a small subset of the data from the table visualization when they export the report page as a PDF. In this blog post, we will introduce you to paginated reports in PowerBI and show you how to create one using PowerBI Report Builder.
Microsoft Fabric combines multiple elements into a single platform – Image courtesy of Microsoft The contribution of PowerBI The integration of Microsoft PowerBI and Microsoft Fabric offers a powerful combination for organizations seeking comprehensive data analytics and insights.
Summary : Microsoft Fabric is an end-to-end Data Analytics platform designed for integration, processing, and advanced insights, while PowerBI excels in creating interactive visualisations and reports. Key Takeaways Microsoft Fabric is a full-scale data platform, while PowerBI focuses on visualising insights.
The Datamarts capability opens endless possibilities for organizations to achieve their data analytics goals on the PowerBI platform. Before we look into the PowerBI Datamarts, let us take a step back and understand the meaning of a Datamart. What is PowerBI Datamarts? What is a Datamart?
At this point, PowerBI has extended itself beyond the definition of just a data visualization tool and truly is a robust business intelligence platform. One of the more powerful elements of PowerBI is the ability to distribute reporting to end users for self-service analytics through a PowerBI Workspace App.
PowerBI is a versatile and scalable platform that combines self-service and enterprise business intelligence (BI) capabilities. Data Analysis Expressions (DAX) is the formula expression language employed in PowerBI. What is the SWITCH Function? How is the SWITCH Function Different From the IF Statement?
In any case, these are definitely not major portions of the exam. R PowerBI Publishing Azure ML models. The exam questions are pulled from a pool of questions, so it is possible these topics may be cover on a different person’s exam.
Visualization libraries available in Python such as Matplotlib and Seaborn, and tools like Tableau and PowerBI become crucial to telling stories that lead to insights. This definition specifically describes the Data Scientist as being the predictive powerhouse of the data science ecosystem.
Interviewers aren’t just looking for textbook definitions; they want to understand your thought process, your design principles, your familiarity with tools, and your ability to communicate complex information effectively through visuals. Tableau with live connections to optimized databases, PowerBI DirectQuery).
Both AI and BI are deployed by collecting and analyzing large volumes of data. Somewhat similar definitions might be misleading. In AI it refers to computer intelligence, while in BI it is about smart decision-making in business influenced by data analysis and visualization. When in fact, it is not the same intelligence.
So whenever you hear that Process Mining can prepare RPA definitions you can expect that Task Mining is the real deal. It is therefore hardly surprising that some process mining tools are actually just a plugin for PowerBI, Tableau or Qlik.
Definition and explanation Accuracy refers to how close the data is to the true or actual value. Examples include Tableau and PowerBI. Data fidelity refers to the accuracy, completeness, consistency, and timeliness of data. In other words, it’s the degree to which data can be trusted to be accurate and reliable.
Data visualization tools like Tableau and PowerBI can be applied to inform decisions. Definition and Scope of a Business Analysts Work Your work as a BA extends beyond crunching numbers. Collaborate proactively with stakeholders to achieve aligned project goals. Who Is a Business Analyst?
For years, spreadsheet programs like Microsoft Excel, Google sheet, and more sophisticated programs like Microsoft PowerBI have been the primary tools for data analysis. These tools help companies boost productivity , reduce costs and achieve other objectives.
Configure Business Logic Utilize the Power Platform’s business rules and processes to configure the app’s logic. Model-Driven Apps allow for the definition of business processes, ensuring a standardized and efficient workflow. Leverage the built-in design features to enhance user experience.
Definition and explanation Accuracy refers to how close the data is to the true or actual value. Examples include Tableau and PowerBI. Data fidelity refers to the accuracy, completeness, consistency, and timeliness of data. In other words, it’s the degree to which data can be trusted to be accurate and reliable.
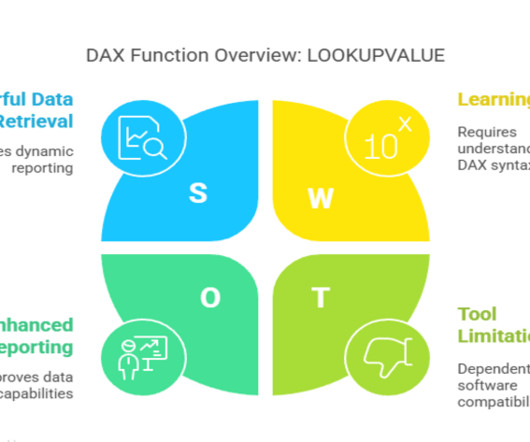
It helps retrieve values from tables based on specific conditions, making it a powerful tool for data analysis in PowerBI and Excel. By the end, you’ll have a solid grasp of how and when to leverage dax lookupvalue in your PowerBI reports or Excel Power Pivot models.
The challenges of managing and monitoring the usage of Alteryx Server, especially for companies that rely on this powerful data analytics platform to support their business operations, can definitely be improved.
Summary: This blog provides a comprehensive overview of data collection, covering its definition, importance, methods, and types of data. This blog aims to provide a comprehensive overview of data collection, including its definition, importance, methods, types of data, tools, and techniques for effective data collection.
Something quite common in the routine of those who manage applications on Servers, such as the Alteryx Server , Tableau Server , PowerBI Server , or even Snowflake Data Cloud , is solving problems that users occasionally face or at least carrying out troubleshooting.
Document and Communicate Maintain thorough documentation of fact table designs, including definitions, calculations, and relationships. Establish data governance policies and processes to ensure consistency in definitions, calculations, and data sources. Consider factors such as data volume, query patterns, and hardware constraints.
Document Hierarchy Structures Maintain thorough documentation of hierarchy designs, including definitions, relationships, and data sources. Business Intelligence Tools BI tools such as Tableau , PowerBI, and Looker allow users to visualise and interact with hierarchical data, enabling them to explore insights at different levels of detail.
Programs like Pickl.AI’s Data Science Job Guarantee Course promise data expertise including statistics, PowerBI , Machine Learning and guarantee job placement upon completion. Free Online Statistics Course Educba 1+ video hours It features an extensive curriculum presented through high-definition video tutorials.
If your organization is large, you definitely need to look for robustness. Business Intelligence Tools: Business intelligence (BI) tools are used to visualize your data. Examples of BI tools include Looker, PowerBI , and Tableau. You should look for a data warehouse that is scalable, flexible, and efficient.
It involves changing the database’s structure, such as adding or deleting tables, modifying column definitions, or altering relationships between tables. While Excel is not as powerful as specialized data manipulation tools, it is widely accessible and user-friendly.
2 Denn heute spielt die Definition darüber, was Big Data eigentlich genau ist, wirklich keine Rolle mehr. Cloud Computing , erst mit den Infrastructure as a Service (IaaS) Angeboten von Amazon, Microsoft und Google, wurde zum Enabler für schnelle, flexible Big Data Architekturen.
This can include explanations of data sources, definitions of terms, or notes on significant observations. Additionally, there are user-friendly tools like Tableau, PowerBI, or Google Data Studio that offer drag-and-drop interfaces for creating visualizations without extensive coding.
Moreover, its ability to integrate seamlessly with Microsoft tools (Office 365, Teams, PowerBI) and third-party applications makes collaboration and data access much easier. Moreover, integration with PowerBI provides advanced reporting capabilities, offering visual insights into financial metrics.
We organize all of the trending information in your field so you don't have to. Join 17,000+ users and stay up to date on the latest articles your peers are reading.
You know about us, now we want to get to know you!
Let's personalize your content
Let's get even more personalized
We recognize your account from another site in our network, please click 'Send Email' below to continue with verifying your account and setting a password.


Let's personalize your content