This site uses cookies to improve your experience. To help us insure we adhere to various privacy regulations, please select your country/region of residence. If you do not select a country, we will assume you are from the United States. Select your Cookie Settings or view our Privacy Policy and Terms of Use.
Cookie Settings
Cookies and similar technologies are used on this website for proper function of the website, for tracking performance analytics and for marketing purposes. We and some of our third-party providers may use cookie data for various purposes. Please review the cookie settings below and choose your preference.
Used for the proper function of the website
Used for monitoring website traffic and interactions
Cookie Settings
Cookies and similar technologies are used on this website for proper function of the website, for tracking performance analytics and for marketing purposes. We and some of our third-party providers may use cookie data for various purposes. Please review the cookie settings below and choose your preference.
Strictly Necessary: Used for the proper function of the website
Performance/Analytics: Used for monitoring website traffic and interactions
Spencer Czapiewski August 6, 2024 - 6:34pm Kyle Massey VP Lead Software Engineer Kyle Massey, a two-time Tableau DataDev Ambassador and co-leader of the DataPride Tableau User Group, shares his experience with VizQL Data Service. It’s one of the things that makes Tableau so easy to get started with. What is VizQL Data Service?
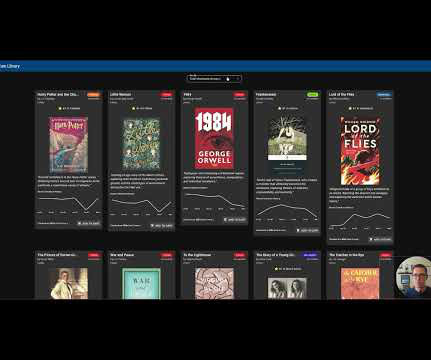
Technical Fellow, Tableau. Tableau has been helping people and organizations to see and understand data for almost two decades, bringing exciting innovations to the landscape of business intelligence with every product release. I am proud to announce that my History of Tableau Innovation viz is now published to Tableau Public.
Technical Fellow, Tableau. Tableau has been helping people and organizations to see and understand data for almost two decades, bringing exciting innovations to the landscape of business intelligence with every product release. I am proud to announce that my History of Tableau Innovation viz is now published to Tableau Public.
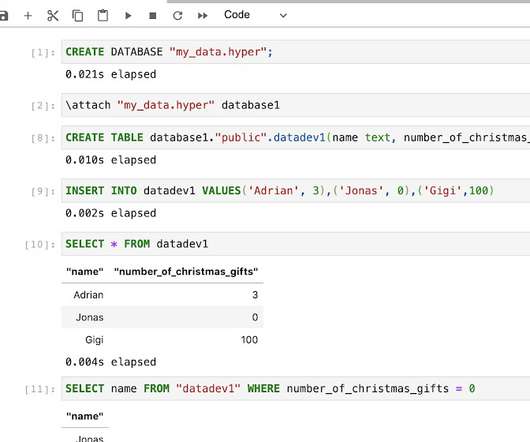
Though both are great to learn, what gets left out of the conversation is a simple yet powerful programming language that everyone in the data science world can agree on, SQL. But why is SQL, or Structured Query Language , so important to learn? Let’s start with the first clause often learned by new SQL users, the WHERE clause.
For the last Sprint Demos, we featured some exciting updates: Personal Access Token impersonation, auto-disabling Webhooks, new Webhooks payload for Slack, and JupyterLab integration for the Hyper API. Webhooks is a notification service that allows you to integrate Tableau with any external server. In the 2021.1 Auto-disable Webhooks.
The prompts are managed through Lambda functions to use OpenSearch Service and Anthropic Claude 2 on Amazon Bedrock to search the client’s database and generate an appropriate response to the client’s business analysis, including the response in plain English, the reasoning, and the SQL code.
With the help of SQL and R, this tool analyzes your data and turns it into pretty interactive dashboards within minutes. You can add time-based and custom filters, write SQL, get charts, and share dashboards with the team. Its analytics can integrate with different SQL databases and different data warehouses. Tableau Desktop.
For the last Sprint Demos, we featured some exciting updates: Personal Access Token impersonation, auto-disabling Webhooks, new Webhooks payload for Slack, and JupyterLab integration for the Hyper API. Webhooks is a notification service that allows you to integrate Tableau with any external server. In the 2021.1 Auto-disable Webhooks.
TrustCheck also integrates with third-party business intelligence tools through our native APIs and is immediately available in Alation V R1 with Tableau Server and Salesforce Einstein analytics. That leads to the question, “How do I know which Tableau data sources to trust?” Conclusion.
Alation BI Bake Off Demo. Alation catalogs and crawls all of your data assets, whether it is in a traditional relational data set (MySQL, Oracle, etc), a SQL on Hadoop system (Presto, SparkSQL,etc), a BI visualization or something in a file system, such as HDFS or AWS S3. Learn more by watching the full demo of Alation’s BI Bake Off.
Data Analytics Platforms: Tableau, Power BI, Looker, Alteryx, Google Analytics, SPSS, SAP, Pandas. The most common trend shouldn’t come as a surprise, as the most in-demand data analytics platforms revolve around reporting, such as Tableau, Power BI, Looker, Alteryx, Google Analytics, SPSS, and SAP.
The Data Analytics Sequence is focused on helping BC’s MBA students develop these skills through expert-taught courses with a strong emphasis on hands-on practice with essential tools like R, Python, SQL, and Tableau.
It covers essential topics such as SQL queries, data visualization, statistical analysis, machine learning concepts, and data manipulation techniques. Key Takeaways SQL Mastery: Understand SQL’s importance, join tables, and distinguish between SELECT and SELECT DISTINCT. How do you join tables in SQL?
Imagine writing a SQL query or using a BI dashboard with flags & warnings on compliance best practice within your natural workflow. Second, managing policies in SQL is simply not scalable. TrustCheck can be integrated with popular business intelligence BI tools, like Tableau, which supply quality information as you use these tools.
These include the following: Introduction to Data Science Introduction to Python SQL for Data Analysis Statistics Data Visualization with Tableau 5. These include the following: Introduction to Data Science Introduction to Python SQL for Data Analysis Statistics Data Visualization with Tableau 5.
A story pointing one, Tableau specific one, SQL query one, excel formula one << those have a wealth of knowledge bases to pull from and can be a SSOT GPT for me personally Can you explain a bit more about GPTs? We have serious and non-serious chats and channels and even held a quick demo on the GPT builder last night.
Streamlined Metric Creation and Management: With MetricFlow, you can easily establish and oversee company metrics through flexible abstractions and SQL query generation. Tableau (beta) Google Sheets (beta) Hex Klipfolio PowerMetrics Lightdash Mode Push.ai What are the four principles of data mesh?
We organize all of the trending information in your field so you don't have to. Join 17,000+ users and stay up to date on the latest articles your peers are reading.
You know about us, now we want to get to know you!
Let's personalize your content
Let's get even more personalized
We recognize your account from another site in our network, please click 'Send Email' below to continue with verifying your account and setting a password.


Let's personalize your content