This site uses cookies to improve your experience. To help us insure we adhere to various privacy regulations, please select your country/region of residence. If you do not select a country, we will assume you are from the United States. Select your Cookie Settings or view our Privacy Policy and Terms of Use.
Cookie Settings
Cookies and similar technologies are used on this website for proper function of the website, for tracking performance analytics and for marketing purposes. We and some of our third-party providers may use cookie data for various purposes. Please review the cookie settings below and choose your preference.
Used for the proper function of the website
Used for monitoring website traffic and interactions
Cookie Settings
Cookies and similar technologies are used on this website for proper function of the website, for tracking performance analytics and for marketing purposes. We and some of our third-party providers may use cookie data for various purposes. Please review the cookie settings below and choose your preference.
Strictly Necessary: Used for the proper function of the website
Performance/Analytics: Used for monitoring website traffic and interactions
Unlocking efficient legal document classification with NLP fine-tuning Image Created by Author Introduction In today’s fast-paced legal industry, professionals are inundated with an ever-growing volume of complex documents — from intricate contract provisions and merger agreements to regulatory compliance records and court filings.
Models like ChatGPT and LLama can generate text and code, perform exploratorydataanalysis, and automate documentation, which introduces countless opportunities for data science efficiencies. Generative AI (GenAI) has undoubtedly taken the spotlight as this years defining innovation.
For those doing exploratorydataanalysis on tabular data: there is Sketch, a code-writing assistant that seamlessly integrates bits of your dataframes into promptsI’ve made this map using Sketch, Jupyter, Geopandas, and Keplergl For us, data professionals, AI advancements bring new workflows and enhance our toolset.
There are also plenty of data visualization libraries available that can handle exploration like Plotly, matplotlib, D3, Apache ECharts, Bokeh, etc. In this article, we’re going to cover 11 data exploration tools that are specifically designed for exploration and analysis. Output is a fully self-contained HTML application.
Google Releases a tool for Automated ExploratoryDataAnalysis Exploring data is one of the first activities a data scientist performs after getting access to the data. This command-line tool helps to determine the properties and quality of the data as well the predictive power.
This 66 MB corpus contains 50K documents or ~13.9M Our study is built around several fundamental standard text analysis tasks essential for downstream NLP applications. We aim to explore document length and word frequency distributions. It’s too small to accommodate all the data in the IMDB dataset.
Once you have downloaded the dataset, you can upload it to the Watson Studio instance by going to the Assets tab and then dropping the data files as shown below. Add Data You can access the data from the notebook once it has been added to the Watson Studio project. Dataframe head 2.
You can create a new environment for your Data Science projects, ensuring that dependencies do not conflict. Jupyter Notebook is another vital tool for Data Science. It allows you to create and share live code, equations, visualisations, and narrative text documents.
For access to the data used in this benchmark notebook, sign up for the competition here. KG 2 bfaiol.wav nonword_repetition chav KG 3 ktvyww.wav sentence_repetition ring the bell on the desk to get her attention 2 4 htfbnp.wav blending kite KG We'll join these datasets together to help with our exploratorydataanalysis.
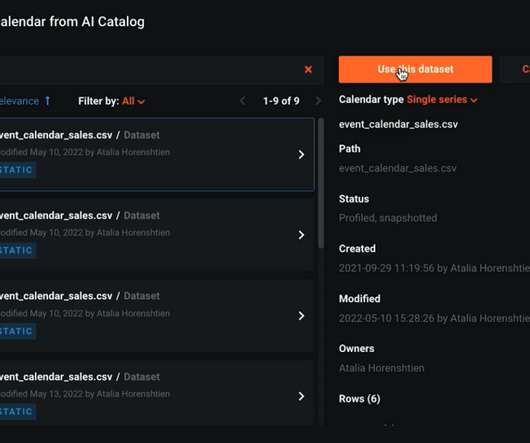
With Text AI, we’ve made it easy for you to understand how our DataRobot platform has used your text data and the resulting insights. Watch a demo recording , access documentation , and contact our team to request a demo. It is part of our new 7.3 No additional licenses are needed to use Text AI. Do More with Text AI. Request a Demo.
Ignoring the business context can lead to analysis irrelevant to the organization’s needs. Hence, a data scientist needs to have a strong business acumen. Not Documenting Your AnalysisDocumentation is crucial to ensure others can understand your analysis and replicate your results.
Semi-Structured Data: Data that has some organizational properties but doesn’t fit a rigid database structure (like emails, XML files, or JSON data used by websites). Unstructured Data: Data with no predefined format (like text documents, social media posts, images, audio files, videos).
If your dataset is not in time order (time consistency is required for accurate Time Series projects), DataRobot can fix those gaps using the DataRobot Data Prep tool , a no-code tool that will get your data ready for Time Series forecasting. Prepare your data for Time Series Forecasting. Perform exploratorydataanalysis.
Register the Data Wrangler application within the IdP Refer to the following documentation for the IdPs that Data Wrangler supports: Azure AD Okta Ping Federate Use the documentation provided by your IdP to register your Data Wrangler application.
Data preprocessing is essential for preparing textual data obtained from sources like Twitter for sentiment classification ( Image Credit ) Influence of data preprocessing on text classification Text classification is a significant research area that involves assigning natural language text documents to predefined categories.
Data storage : Store the data in a Snowflake data warehouse by creating a data pipe between AWS and Snowflake. Data Extraction, Preprocessing & EDA : Extract & Pre-process the data using Python and perform basic ExploratoryDataAnalysis. Please refer to this documentation link.
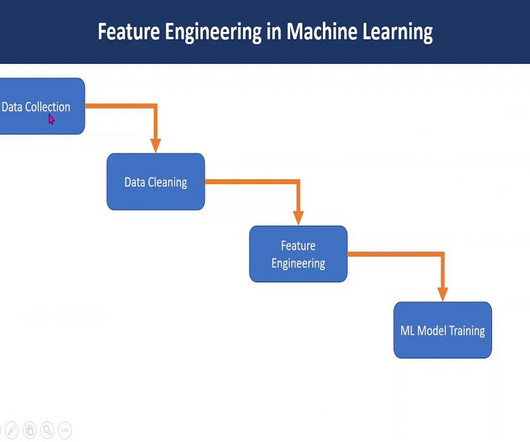
Feature engineering in machine learning is a pivotal process that transforms raw data into a format comprehensible to algorithms. Through ExploratoryDataAnalysis , imputation, and outlier handling, robust models are crafted. Text feature extraction Objective: Transforming textual data into numerical representations.
This community-driven approach ensures that there are plenty of useful analytics libraries available, along with extensive documentation and support materials. For Data Analysts needing help, there are numerous resources available, including Stack Overflow, mailing lists, and user-contributed code.
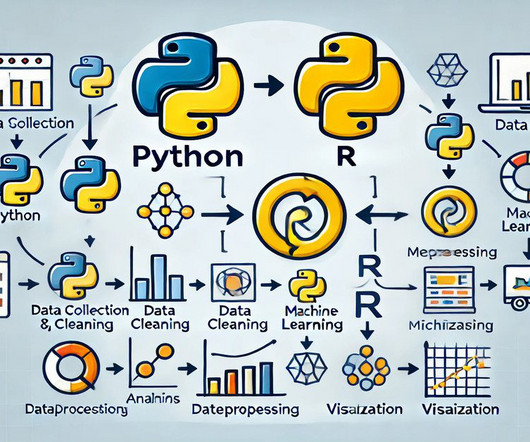
This workflow is useful when you can utilise Python’s numerical computation capabilities within an R-based analysis pipeline. Integration via Jupyter Notebooks Jupyter Notebooks offer a powerful environment for running Python in the same document, thanks to the support for multiple kernels.
These packages allow for text preprocessing, sentiment analysis, topic modeling, and document classification. It allows data scientists to combine code, documentation, and visualizations in a single document, making it easier to share and reproduce analyses.
Key Features No labelled data is required; the model identifies patterns or structures. Typically used for clustering (grouping data into categories) or dimensionality reduction (simplifying data without losing important information). Often used for exploratoryDataAnalysis.
At the same time such plant data have very complicated structures and hard to label. And also in my work, have to detect certain values in various formats in very specific documents, in German. Such data are far from general datasets, and even labeling is hard in that case. “Shut up and annotate!”
Plotly allows developers to embed interactive features such as zooming, panning, and hover effects directly into the plots, making it ideal for ExploratoryDataAnalysis and dynamic reports.
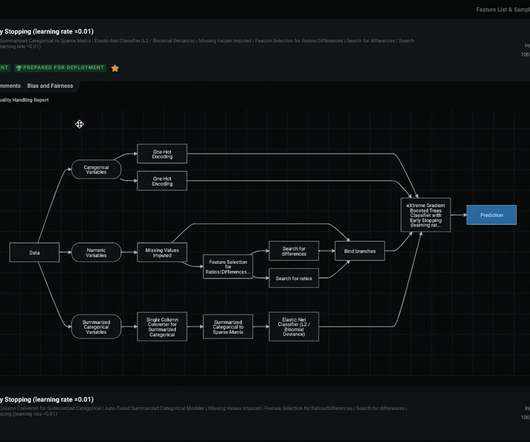
These capabilities take the form of: Exploratorydataanalysis to prepare basic features from raw data. Specialized automated feature engineering and reduction for time series data. DataRobot Feature Lineage allows users to audit the full data lineage in a simple and fully documented graphical representation.
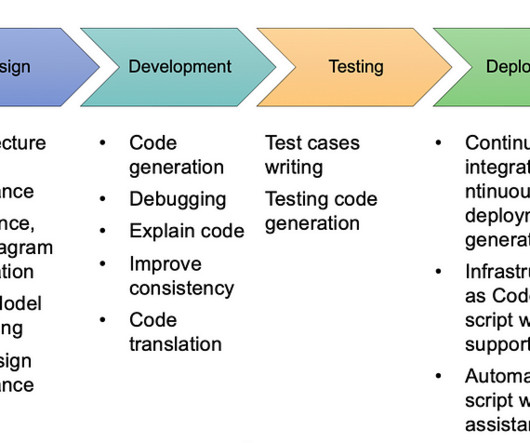
A typical SDLC has following stages: Stage1: Planning and requirement analysis, defining Requirements Gather requirement from end customer. Functional and non-functional requirements need to be documented clearly, which architecture design will be based on and support. New developers should learn basic concepts (e.g.
I started my project with a simple data set with historical information of coupons sent to clients and a target variable that captured information about whether the coupon was redeemed or not in the past. The DataRobot model blueprints allow users to rapidly test many different modeling approaches and increase model diversity and accuracy.
While there are a lot of benefits to using data pipelines, they’re not without limitations. Traditional exploratorydataanalysis is difficult to accomplish using pipelines given that the data transformations achieved at each step are overwritten by the proceeding step in the pipeline.
While there are a lot of benefits to using data pipelines, they’re not without limitations. Traditional exploratorydataanalysis is difficult to accomplish using pipelines given that the data transformations achieved at each step are overwritten by the proceeding step in the pipeline.
While there are a lot of benefits to using data pipelines, they’re not without limitations. Traditional exploratorydataanalysis is difficult to accomplish using pipelines given that the data transformations achieved at each step are overwritten by the proceeding step in the pipeline.
Documenting Objectives: Create a comprehensive document outlining the project scope, goals, and success criteria to ensure all parties are aligned. Making Data Stationary: Many forecasting models assume stationarity. accuracy, precision). Visualization tools can help in understanding these aspects better.
We will also explore the opportunities and factors to be taken into account while using ChatGPT for Data Science. Leveraging ChatGPT for Data Science ChatGPT for DataAnalysis ChatGPT is a useful tool for Data Scientists. It facilitates exploratoryDataAnalysis and provides quick insights.
And that’s what we’re going to focus on in this article, which is the second in my series on Software Patterns for Data Science & ML Engineering. I’ll show you best practices for using Jupyter Notebooks for exploratorydataanalysis. When data science was sexy , notebooks weren’t a thing yet. documentation.
Microsoft Azure offers a comprehensive suite of services pivotal in Data Science, including Azure Machine Learning, Azure Databricks, and Azure Synapse Analytics. Begin by exploring these tools through online tutorials, documentation, and practical exercises on platforms like Microsoft Learn.
Here are some notable applications where KNN shines: Classification Tasks Image Recognition: KNN is adept at classifying images into different categories, making it invaluable in applications like facial recognition, object detection, and medical image analysis. Unlock Your Data Science Career with Pickl.AI
Jupyter notebooks allow you to create and share live code, equations, visualisations, and narrative text documents. Jupyter notebooks are widely used in AI for prototyping, data visualisation, and collaborative work. Their interactive nature makes them suitable for experimenting with AI algorithms and analysing data.
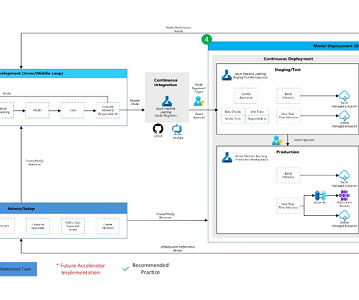
Model Development (Inner Loop): The inner loop element consists of your iterative data science workflow. A typical workflow is illustrated here from data ingestion, EDA (ExploratoryDataAnalysis), experimentation, model development and evaluation, to the registration of a candidate model for production.
The objective of clustering is to discover hidden relationships, similarities, or patterns in the data without any prior knowledge or guidance. It can be applied to a wide range of domains and has numerous practical applications , such as customer segmentation, image and document categorization, anomaly detection, and social network analysis.
Deep Learning : A subset of Machine Learning that uses Artificial Neural Networks with multiple hidden layers to learn from complex, high-dimensional data. ExploratoryDataAnalysis (EDA): Analysing and visualising data to discover patterns, identify anomalies, and test hypotheses.
You can understand the data and model’s behavior at any time. Once you use a training dataset, and after the ExploratoryDataAnalysis, DataRobot flags any data quality issues and, if significant issues are spotlighted, will automatically handle them in the modeling stage. Rapid Modeling with DataRobot AutoML.
As an example for catalogue data, it’s important to check if the set of mandatory fields like product title, primary image, nutritional values, etc. are present in the data. So, we need to build a verification layer that runs based on a set of rules to verify and validate data before preparing it for model training.
It is therefore important to carefully plan and execute data preparation tasks to ensure the best possible performance of the machine learning model. It is also essential to evaluate the quality of the dataset by conducting exploratorydataanalysis (EDA), which involves analyzing the dataset’s distribution, frequency, and diversity of text.
It is important to experience such problems as they reflect a lot of the issues that a data practitioner is bound to experience in a business environment. We first get a snapshot of our data by visually inspecting it and also performing minimal ExploratoryDataAnalysis just to make this article easier to follow through.
We organize all of the trending information in your field so you don't have to. Join 17,000+ users and stay up to date on the latest articles your peers are reading.
You know about us, now we want to get to know you!
Let's personalize your content
Let's get even more personalized
We recognize your account from another site in our network, please click 'Send Email' below to continue with verifying your account and setting a password.


Let's personalize your content