This site uses cookies to improve your experience. To help us insure we adhere to various privacy regulations, please select your country/region of residence. If you do not select a country, we will assume you are from the United States. Select your Cookie Settings or view our Privacy Policy and Terms of Use.
Cookie Settings
Cookies and similar technologies are used on this website for proper function of the website, for tracking performance analytics and for marketing purposes. We and some of our third-party providers may use cookie data for various purposes. Please review the cookie settings below and choose your preference.
Used for the proper function of the website
Used for monitoring website traffic and interactions
Cookie Settings
Cookies and similar technologies are used on this website for proper function of the website, for tracking performance analytics and for marketing purposes. We and some of our third-party providers may use cookie data for various purposes. Please review the cookie settings below and choose your preference.
Strictly Necessary: Used for the proper function of the website
Performance/Analytics: Used for monitoring website traffic and interactions
PowerBI Desktop is a wonderful business intelligence tool that has an expansive list of reporting capabilities, but there is one thing that you aren’t able to do with it – create a paginated report, which is a specific style of report that is designed to be exported or printed. What Is PowerBI Report Builder?
How to Optimize PowerBI and Snowflake for Advanced Analytics Spencer Baucke May 25, 2023 The world of business intelligence and data modernization has never been more competitive than it is today. Table of Contents Why Discuss Snowflake & PowerBI?
PowerBI Desktop enables the connection and retrieval of data from various sources, followed by data transformation using Power Query. To address this challenge, Microsoft introduced Dataflows within the PowerBI service. What are Dataflows in PowerBI?
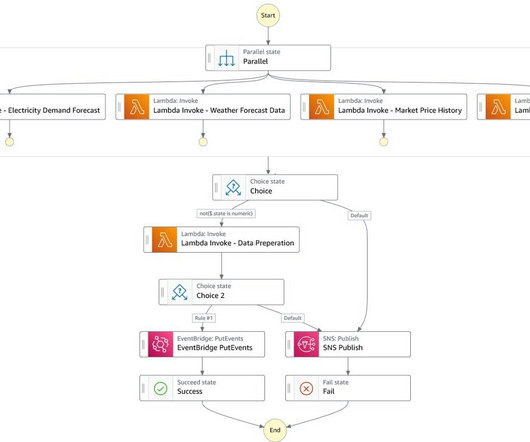
The prompts are managed through Lambda functions to use OpenSearch Service and Anthropic Claude 2 on Amazon Bedrock to search the client’s database and generate an appropriate response to the client’s business analysis, including the response in plain English, the reasoning, and the SQL code.
Data preprocessing is essential for preparing textual data obtained from sources like Twitter for sentiment classification ( Image Credit ) Influence of data preprocessing on text classification Text classification is a significant research area that involves assigning natural language text documents to predefined categories.
I find that R markdown is most useful for making reports or documents with your analysis. Python, R, SQL) code analysis in jupyter notebook, using Markdown notation — File —Download as (pdf, html, docx, etc) document 2. Most recently, report documents appear to be obsolete ! R markdown (.rmd) R markdown (.rmd)
Here are steps you can follow to pursue a career as a BI Developer: Acquire a solid foundation in data and analytics: Start by building a strong understanding of data concepts, relational databases, SQL (Structured Query Language), and data modeling.
Gather, validate, and document business requirements. Both roles require strong analytical skills, proficiency in SQL and other programming languages, and the ability to interpret data and provide insights. Data Analysis: Proficiency in data analysis tools and techniques such as SQL, Excel, and data visualisation tools (e.g.,
BI Tool Integration: A new dbt Semantic Layer connection to PowerBI is coming soon! Again, for the category, we have two major announcements: Visual Low-Code Editor: An intuitive, visual drag-and-drop interface (currently in private beta) that allows you to create dbt models without writing SQL.
Because they are the most likely to communicate data insights, they’ll also need to know SQL, and visualization tools such as PowerBI and Tableau as well. Some of the tools you can expect to see used will be PowerBI and Tableau Data Architect Before you ask, yes a data architect and a data engineer are quite different.
Document Hierarchy Structures Maintain thorough documentation of hierarchy designs, including definitions, relationships, and data sources. This documentation is invaluable for future reference and modifications. Simplify hierarchies where possible and provide clear documentation to help users understand the structure.
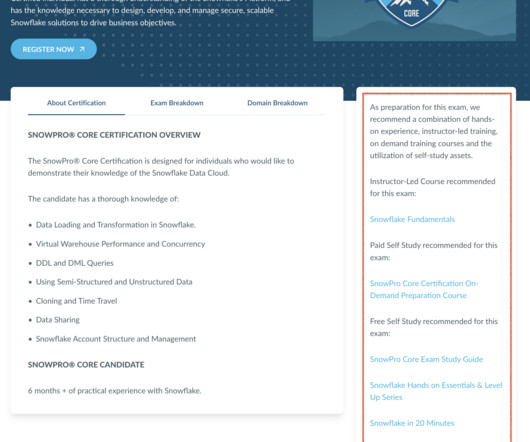
In the case of practice tests and quizzes, find the relevant section within Snowflake’s documentation for each question. The Snowpark playlist , in particular, is an invaluable source for learning about Snowpark: Snowflake’s set of libraries and runtimes that securely deploy and process non-SQL code.
The software you might use OAuth with includes: Tableau PowerBI Sigma Computing If so, you will need an OAuth provider like Okta, Microsoft Azure AD, Ping Identity PingFederate, or a Custom OAuth 2.0 For greater detail, see the Snowflake documentation. And once again, for loading data, do not use SQL Inserts.
Marubeni’s internal models are based on Long Short-Term Memory (LSTM) architectures, which are well documented and easy to implement and customize in TensorFlow. Amazon Athena to provide developers and business analysts SQL access to the generated data for analysis and troubleshooting.
Clean and Prepare Data: Ensure that your datasets are clean, well-organized, and properly documented. Python, R, SQL), any libraries or frameworks, and data manipulation techniques employed. You can enormously take up SQL Projects for Data Analyst portfolio showcasing your skills.
Grasp the Fundamentals of Data Analysis and Management Build a strong foundation in Data Analysis by learning data manipulation techniques using SQL and Excel. Focus on Python and R for Data Analysis, along with SQL for database management. This foundational knowledge is essential for any Data Science project.
SQL (Structured Query Language) SQL is a standard language for managing relational databases. Also, it provides powerful commands for querying, filtering, sorting, and aggregating data. SQL is commonly used for data manipulation tasks, especially with structured datasets.
What technology or platform can meet the needs of the business, from basic report creation to complex document analysis to machine learning workflows? One such feature is Document AI. This new feature enables the processing and extracting of data from documents in various formats and structures.
documents and images). Common tools used in Business Intelligence architecture include ETL tools like Talend or Informatica for data integration, Tableau or PowerBI for visualization, and SQL databases for storage. Data can be structured (e.g., databases), semi-structured (e.g., XML files), or unstructured (e.g.,
You should be skilled in programming languages such as Python, R, or SQL , which are commonly used for data manipulation and analysis. Azure Synapse Analytics Previously known as Azure SQL Data Warehouse , Azure Synapse Analytics offers a limitless analytics service that combines big data and data warehousing.
Unstructured Data: Data without a predefined structure, like text documents, social media posts, or images. SQL (Structured Query Language): Language for managing and querying relational databases. Tableau/PowerBI: Visualization tools for creating interactive and informative data visualizations.
Document and Communicate Maintain thorough documentation of fact table designs, including definitions, calculations, and relationships. Consider factors such as data volume, query patterns, and hardware constraints. Use indexing and partitioning strategies to improve query performance.
While knowing Python, R, and SQL is expected, youll need to go beyond that. Classification techniques, such as image recognition and document categorization, remain essential for a wide range of industries. Employers arent just looking for people who can program.
A legacy data stack usually refers to the traditional relational database management system (RDBMS), which uses a structured query language (SQL) to store and process data. SQL, however, remains a popular query language for both legacy and modern data stacks. Examples of BI tools include Looker, PowerBI , and Tableau.
Unlike traditional relational databases, MongoDB stores data in flexible, JSON-like documents, allowing for dynamic schemas. Critical features of MongoDB include: Horizontal scalability, High availability through replica sets and A powerful aggregation framework that supports complex queries and data transformations. What Is MongoDB?
Copilot automates those repetitive tasks, like writing DAX queries or creating PowerBI visuals, so that you can focus on the big picture. Accelerate Learning: Fabric is a powerful platform with a steep learning curve. PowerBI: Creating visualizations in PowerBI can be time-consuming.
Tools like Python, SQL, Apache Spark, and Snowflake help engineers automate workflows and improve efficiency. Python, SQL, and Apache Spark are essential for data engineering workflows. SQL Structured Query Language ( SQL ) is a fundamental skill for data engineers.
We organize all of the trending information in your field so you don't have to. Join 17,000+ users and stay up to date on the latest articles your peers are reading.
You know about us, now we want to get to know you!
Let's personalize your content
Let's get even more personalized
We recognize your account from another site in our network, please click 'Send Email' below to continue with verifying your account and setting a password.


Let's personalize your content