This site uses cookies to improve your experience. To help us insure we adhere to various privacy regulations, please select your country/region of residence. If you do not select a country, we will assume you are from the United States. Select your Cookie Settings or view our Privacy Policy and Terms of Use.
Cookie Settings
Cookies and similar technologies are used on this website for proper function of the website, for tracking performance analytics and for marketing purposes. We and some of our third-party providers may use cookie data for various purposes. Please review the cookie settings below and choose your preference.
Used for the proper function of the website
Used for monitoring website traffic and interactions
Cookie Settings
Cookies and similar technologies are used on this website for proper function of the website, for tracking performance analytics and for marketing purposes. We and some of our third-party providers may use cookie data for various purposes. Please review the cookie settings below and choose your preference.
Strictly Necessary: Used for the proper function of the website
Performance/Analytics: Used for monitoring website traffic and interactions
PowerBI proves to be the best tool for analysis and visualization of data. Cloud-based PowerBI technology is a forerunner for corporate executives. It constitutes different versions like PowerBI Desktop, an online PowerBI service as SaaS, PowerBI apps for Windows, Android and iOS.
PowerBI Desktop is a wonderful business intelligence tool that has an expansive list of reporting capabilities, but there is one thing that you aren’t able to do with it – create a paginated report, which is a specific style of report that is designed to be exported or printed. What Is PowerBI Report Builder?
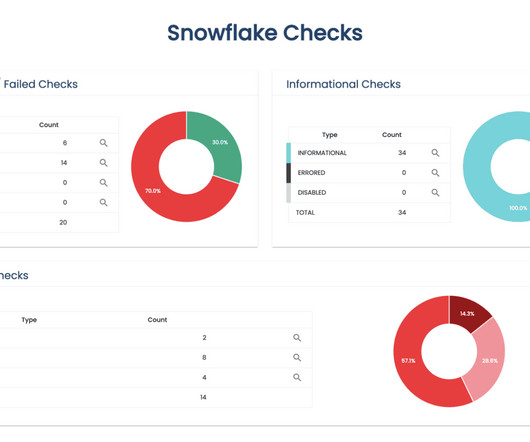
How to Optimize PowerBI and Snowflake for Advanced Analytics Spencer Baucke May 25, 2023 The world of business intelligence and data modernization has never been more competitive than it is today. Just click this button and fill out the form to download it. Table of Contents Why Discuss Snowflake & PowerBI?
When making changes to a PowerBI Dataset, you can have a similar experience. When making changes to large, complex datasets, you can either republish entire Datasets or modify the existing dataset and push only the differences up to the PowerBI Service. What is the ALM Toolkit, and Why Does it Matter?
With the shift towards cloud-based solutions, migrating SQL Server Reporting Services (SSRS) reports to the PowerBI service has become a popular choice for organizations looking to unlock the full potential of their data. Step 1 Open PowerBI Desktop and then click on Get Data to connect to SQL Server. phData can help!
PowerBI Deployment Pipelines give developers the ability to do all three in a single, easy-to-use interface from directly within the PowerBI Service. In this blog, I’ll describe what PowerBI Deployment Pipelines are and why they are useful, and then provide step-by-step directions on how to set them up.
In this blog, we will unfold the benefits of PowerBI and key PowerBI features , along with other details. What is PowerBI? PowerBI is loaded with features that help in making data-driven decisions. Here comes the role of PowerBI. billion by 2028.
The ability to create parameters for your data sources in PowerBI is not new; however, there are nuances to parameterizing your Snowflake connections that one should be aware of. What Are PowerBI Parameters? From the Home menu, click on Get Data (or New Source if you’re in Power Query) and simply search for Snowflake.
Summary: This guide covers visualising KPI in PowerBI, from setting up the tool and preparing data to selecting the right visuals and enhancing dashboards. PowerBI is an excellent tool for this purpose, offering powerful features to create interactive, dynamic visualisations that bring data to life.
Among these tools, KNIME and PowerBI have emerged as key players, catering to the demands of this evolving landscape. Microsoft PowerBI has established itself as a premier data visualization product used to turn unrelated data sources into coherent, visually immersive, and interactive insights.
As organizations embrace the power of self-service analytics and interactive dashboards, transitioning from SSRS to PowerBI becomes an enticing and oftentimes necessary decision. The PowerBI Service further enhances collaboration by enabling easy sharing and embedding reports in web pages and applications.
The best part is that you can download most of them, pull them apart, and try to figure out how they work.” I’ve never tried to create something like that in PowerBI.” With PowerBI your actions are largely predetermined. Paul picks out Viz Office Hours as a great venue for learning and connecting.
Download the pdf version, check out GitHub, and visit the code in Colab. Consider gifting them a subscription to a data visualization tool like Tableau or PowerBI. In this article, I’ll go through sections of code and describe the starter package you need to ace LangChain. All code is on GitHub.
Python, R, SQL) code analysis in jupyter notebook, using Markdown notation — File —Download as (pdf, html, docx, etc) document 2. The “Download as” button on most cloud platforms does NOT even exist anymore. rmd file, I downloaded the notebook (ipynb) from Kaggle and opened it on my PC, then I converted it to a markdown (.md)
The project I did to land my business intelligence internship — CAR BRAND SEARCH ETL PROCESS WITH PYTHON, POSTGRESQL & POWERBI 1. Reporting Data Finally, we will connect pgadmin4 and powerbi to make an interactive dashboard. Figure 11: Project’s GitHub Now, we have to click on the icon of “download”.
Something quite common in the routine of those who manage applications on Servers, such as the Alteryx Server , Tableau Server , PowerBI Server , or even Snowflake Data Cloud , is solving problems that users occasionally face or at least carrying out troubleshooting.
Resume Download (PDF): Provide a downloadable PDF version of your resume so that interested parties can keep it for future reference. Data analysts build interactive dashboards, charts, graphs, and infographics using a variety of programmes and libraries like Tableau , PowerBI , or Python’s Matplotlib and Seaborn.
Download a free PDF by filling out the form. The software you might use OAuth with includes: Tableau PowerBI Sigma Computing If so, you will need an OAuth provider like Okta, Microsoft Azure AD, Ping Identity PingFederate, or a Custom OAuth 2.0 Want to save this guide for later? authorization server.
Course Structure and Accessibility : A well-organised course with clear modules, video content, and downloadable resources enhances your learning experience. Focus on Data Science Tools : Access high-demand tools like Tableau and PowerBI. Ensure the course fits your schedule and learning style.
hours of on-demand video 5 coding exercises 40 articles and 9 downloadable resources Full access on mobile and TV Data Science Job Guarantee Program by Pickl.AI Topics include Reinforcement Learning, NLP, and Deep Learning. Lifetime access with certification upon completion. Course Content: 42.5
Azure AI also integrates with other Microsoft products, such as PowerBI, Dynamics 365, and Office 365, to provide seamless and intelligent experiences across different scenarios. A 2D image of an interior location, whether an image downloaded from the internet or a user-taken photo, is used as input by the application.
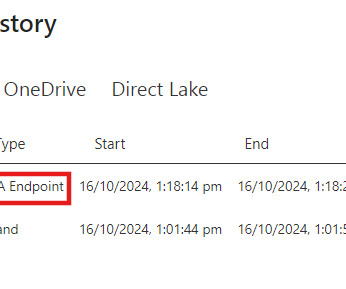
We all know how easy it is to refresh a single table in PowerBI Desktop by right-clicking the table and selecting Refresh Data. However, in PowerBI Service, we can only refresh the entire semantic model, as there is no out-of-the-box solution for refreshing a single table. By refreshing only the relevant table (e.g.,
We organize all of the trending information in your field so you don't have to. Join 17,000+ users and stay up to date on the latest articles your peers are reading.
You know about us, now we want to get to know you!
Let's personalize your content
Let's get even more personalized
We recognize your account from another site in our network, please click 'Send Email' below to continue with verifying your account and setting a password.


Let's personalize your content