This site uses cookies to improve your experience. To help us insure we adhere to various privacy regulations, please select your country/region of residence. If you do not select a country, we will assume you are from the United States. Select your Cookie Settings or view our Privacy Policy and Terms of Use.
Cookie Settings
Cookies and similar technologies are used on this website for proper function of the website, for tracking performance analytics and for marketing purposes. We and some of our third-party providers may use cookie data for various purposes. Please review the cookie settings below and choose your preference.
Used for the proper function of the website
Used for monitoring website traffic and interactions
Cookie Settings
Cookies and similar technologies are used on this website for proper function of the website, for tracking performance analytics and for marketing purposes. We and some of our third-party providers may use cookie data for various purposes. Please review the cookie settings below and choose your preference.
Strictly Necessary: Used for the proper function of the website
Performance/Analytics: Used for monitoring website traffic and interactions
Recognizing the need to harness real-time data, businesses are increasingly turning to event-driven architecture (EDA) as a strategic approach to stay ahead of the curve. At the forefront of this event-driven revolution is Apache Kafka, the widely recognized and dominant open-source technology for event streaming.
In modern enterprises, where operations leave a massive digital footprint, business events allow companies to become more adaptable and able to recognize and respond to opportunities or threats as they occur. Becoming a real-time enterprise Businesses often go on a journey that traverses several stages of maturity when they establish an EDA.
In football analytics, this could mean pulling data from several sources, including event and player performance data. Types of Football Data Event Data: Shot locations, types (on-target/off-target), and outcomes (goal or miss). You may combine event data (e.g., Tracking Data: Player movements and positioning.
Event-driven architecture (EDA) has become more crucial for organizations that want to strengthen their competitive advantage through real-time data processing and responsiveness. In recognizing the benefits of event-driven architectures, many companies have turned to Apache Kafka for their event streaming needs.
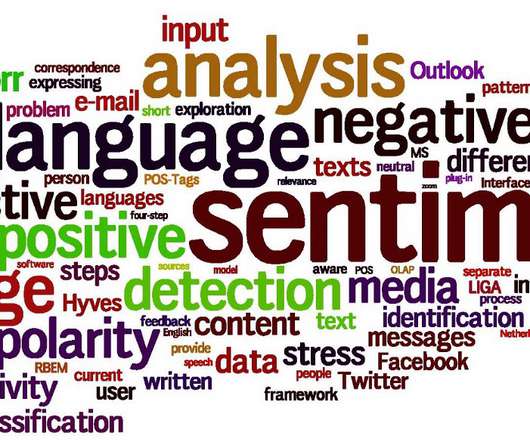
The importance of EDA in the machine learning world is well known to its users. The EDA, the first chance for visualizations, will be the main topic of this article. Exploratory Data Analysis What is EDA? Exploratory Data Analysis (EDA) is a method for analyzing and summarizing data, frequently using visual tools.
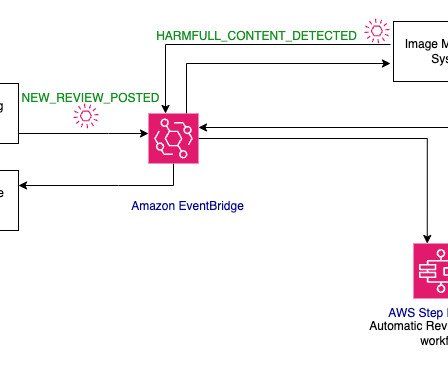
The application uses event-driven architecture (EDA), a powerful software design pattern that you can use to build decoupled systems by communicating through events. The event starts an AWS Step Functions workflow. If the LLM generated response is found to be non-toxic, publish NEW_REVIEW_RESPONSE_CREATED event.
This was useful for event-driven functions, but it was very limited. For example, HPC users tend to have domain expertise — such as EDA, simulations, financial modeling — but they don’t have the skills to provision, manage and secure infrastructure. Serverless does all that for them.
Exploratory Data Analysis (EDA): We unpacked the importance of EDA, the process of uncovering patterns and relationships within your data. It learns from historical data to make predictions about future events. EDA involves techniques like: Identifying different types of variables (categorical, numerical).
The sample application used in the preceding architecture is driven by events. An event is defined as a change in state that has recently occurred. For example, when an object gets uploaded to an Amazon Simple Storage Service (Amazon S3) bucket, Amazon S3 emits an Object Created event.
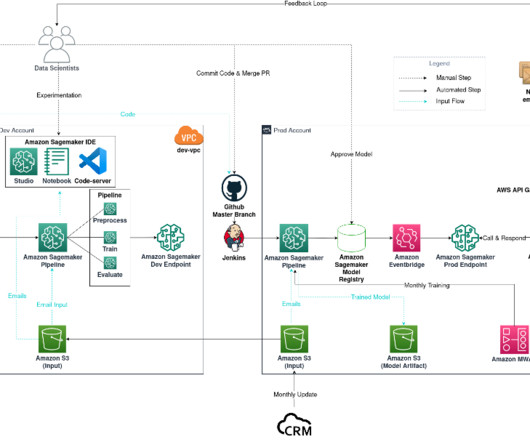
Email classification project diagram The workflow consists of the following components: Model experimentation – Data scientists use Amazon SageMaker Studio to carry out the first steps in the data science lifecycle: exploratory data analysis (EDA), data cleaning and preparation, and building prototype models.
An MLOps workflow consists of a series of steps from data acquisition and feature engineering to training and deployment. else np.random.choice(states) for x in transaction_df['customer_id']]# Mark transaction as fraud if an outliertransaction_df['fraud'] = transaction_df.apply(lambda x: random.random() < 0.1
Different approaches help organisations make sense of raw data, from simply summarising past events to predicting future outcomes. Exploratory Data Analysis (EDA) Exploratory Data Analysis (EDA) is an approach to analyse datasets to uncover patterns, anomalies, or relationships.
We will carry out some EDA on our dataset, and then we will log the visualizations onto the Comet experimentation website or platform. We can accomplish our EDA objectives thanks to Comet’s integration with well-known Python visualization frameworks. train.head() We also perform EDA on the test dataset. The below method .head()
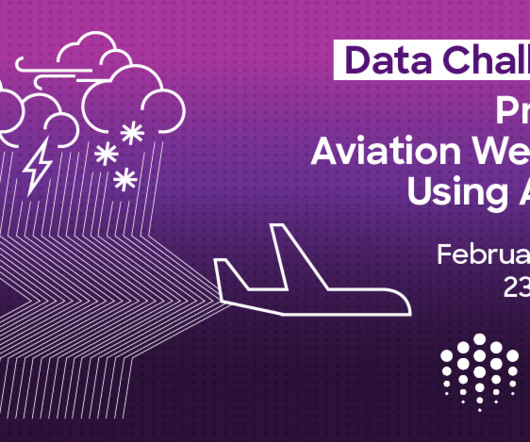
METAR, Miami International Airport (KMIA) on March 9, 2024, at 15:00 UTC In the recently concluded data challenge hosted on Desights.ai , participants used exploratory data analysis (EDA) and advanced artificial intelligence (AI) techniques to enhance aviation weather forecasting accuracy.
These models can predict future events, classify data into categories, or uncover relationships between variables, enabling better decision-making. Exploratory Data Analysis (EDA) : Like intrepid explorers wandering through an uncharted forest, data scientists traverse the terrain of data with curiosity.
Exploratory Data Analysis (EDA): Using statistical summaries and initial visualisations (yes, visualisation plays a role within analysis!) EDA: Calculate overall churn rate. Visualisation Aids Analysis Visualisation is not just an end product; it’s a crucial tool during analysis (especially EDA).
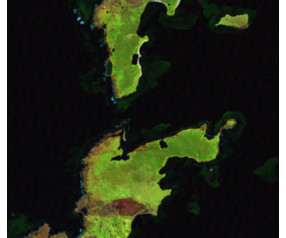
We take a gap year to participate in AI competitions and projects, and organize and attend events. At the time of selecting competitions, this was the most attractive in terms of sustainability, image segmentation being a new type of challenge for this team, and having a topic that would be easy to explain and visualize at events.
Perform exploratory Data Analysis (EDA) using Pandas and visualise your findings with Matplotlib or Seaborn. Engaging in these events fosters community, providing support and motivation as you advance your Python journey for Data Science. This project helps you understand data cleaning and the importance of insights derived from data.
This free, virtual event takes place over two days with 25+ speakers discussing the latest cutting-edge innovations in data science and machine learning. In order to accomplish this, we will perform some EDA on the Disneyland dataset, and then we will view the visualization on the Comet experimentation website or platform.
In order to accomplish this, we will perform some EDA on the Disneyland dataset, and then we will view the visualization on the Comet experimentation website or platform. Comet’s interoperability with well-known Python visualization frameworks enables us to achieve our EDA goals. Let’s get started! You can learn more about Comet here.
It is designed to make it easy to track and monitor experiments and conduct exploratory data analysis (EDA) using popular Python visualization frameworks. Comet is an MLOps platform that offers a suite of tools for machine-learning experimentation and data analysis.
We use the model preview functionality to perform an initial EDA. He designs modern application architectures based on microservices, serverless, APIs, and event-driven patterns. He works with customers to realize their data analytics and machine learning goals through adoption of DataOps and MLOps practices and solutions.
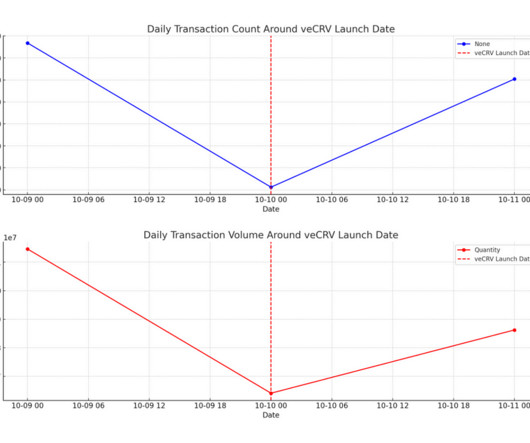
Inside these pages covered a spectrum of topics from Exploratory Data Analysis (EDA), to the impact of veCRV on the protocol's governance and machine learning models. Part 1: Exploratory Data Analysis (EDA) MEV Over 25,000 MEV-related transactions have been executed through Curve. This is better said as game players game the game.
Do you have any suggestions for next year’s event? We will carry out some EDA on our dataset, and then we will log the visualizations onto the Comet experimentation website or platform. Let us know in our Convergence Slack channel.
Challenge Overview Objective : Building upon the insights gained from Exploratory Data Analysis (EDA), participants in this data science competition will venture into hands-on, real-world artificial intelligence (AI) & machine learning (ML).
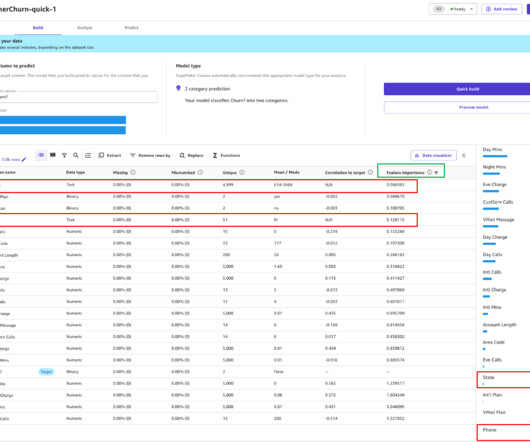
Load and Explore Data We load the Telco Customer Churn dataset and perform exploratory data analysis (EDA). EDA is essential for gaining insights into the dataset’s characteristics and identifying any data preprocessing requirements. Experiment Tracking in CometML (Image by the Author) 2.
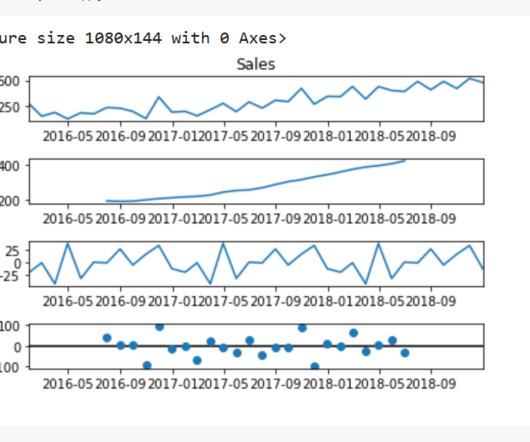
Exploratory Data Analysis (EDA): Conduct EDA to identify trends, seasonal patterns, and correlations within the dataset. This is vital for agriculture, disaster management, and event planning. Making Data Stationary: Many forecasting models assume stationarity. Visualization tools can help in understanding these aspects better.
Create DataGrids with image data using Kangas, and load and visualize image data from hugging face Photo by Genny Dimitrakopoulou on Unsplash Visualizing data to carry out a detailed EDA, especially for image data, is critical.
Some of the most serious effects of global warming include rising sea levels, more extreme weather events, changes in animal and plant life, and soil health & erosion. Explain these trends, considering policy changes, economic shifts, technological advancements, or natural events that might have influenced the observed patterns.
Exploratory data analysis (EDA) and modeling. Create an application pipeline that accepts events or data, prepares the required model features, infers results using one or more models, and drives actions. There are 6 high-level steps in every MLOps project The 6 steps are: Initial data gathering (for exploration).
Diagnostic Analytics Projects: Diagnostic analytics seeks to determine the reasons behind specific events or patterns observed in the data. 3. Predictive Analytics Projects: Predictive analytics involves using historical data to predict future events or outcomes. Root cause analysis is a typical diagnostic analytics task.
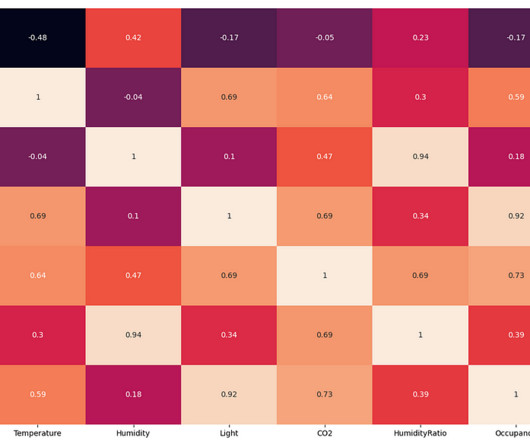
From the above EDA, it is clear that the room's temperature, light, and CO2 levels are good occupancy indicators. The CO2 levels of the room decrease when there is no person in the room. This proves the hypothesis regarding the peaks in the CO2 graph. Therefore, we will be using these three variables for our classification model.
Now you need to perform some EDA and cleaning on the data after loading it into the notebook. EDA and Data Cleaning First, you will check the frequency of the target variable: Category. This variable denotes the type of emotions represented by the Reddit threads.
Exploratory Data Analysis (EDA): Analysing and visualising data to discover patterns, identify anomalies, and test hypotheses. Joint Probability: The probability of two events co-occurring, often used in Bayesian statistics and probability theory.
Before building our model, we will also see how we can visualize this data with Kangas as part of exploratory data analysis (EDA). In this article, let’s dive deep into the Natural Language Toolkit (NLTK) data processing concepts for NLP data.
It is also essential to evaluate the quality of the dataset by conducting exploratory data analysis (EDA), which involves analyzing the dataset’s distribution, frequency, and diversity of text. It is therefore important to carefully plan and execute data preparation tasks to ensure the best possible performance of the machine learning model.
It is the event of a series repeating a certain pattern at certain intervals. I finished to EDA & Time Series Analysis, I will build some ML or DL model. The series has reached peak points at certain intervals . Circularity is actually a concept similar to seasonality. resample('D').mean())
NeuML was working on a real-time sports event tracking application, neuspo but sports along with everything else was being shut down and there were no sports to track. The early days of the effort were spent on EDA and exchanging ideas with other members of the community. How did you spend your time on this competition?
In a real-life scenario you can expect to do more EDA, but for the sake of simplicity we’ll do just enough to get a sense of the process. We first get a snapshot of our data by visually inspecting it and also performing minimal Exploratory Data Analysis just to make this article easier to follow through.
Mid-point review and challenge Q&A event. This challenge included two optional milestones to help solvers understand the challenge goals and learn how well their solution aligned with those goals, an opportunity to get feedback via a mid-point review and a Q&A event. Overall and bonus prize structure.
Operational health events – including operational issues, software lifecycle notifications, and more – serve as critical inputs to cloud operations management. Inefficiencies in handling these events can lead to unplanned downtime, unnecessary costs, and revenue loss for organizations.
We organize all of the trending information in your field so you don't have to. Join 17,000+ users and stay up to date on the latest articles your peers are reading.
You know about us, now we want to get to know you!
Let's personalize your content
Let's get even more personalized
We recognize your account from another site in our network, please click 'Send Email' below to continue with verifying your account and setting a password.


Let's personalize your content