This site uses cookies to improve your experience. To help us insure we adhere to various privacy regulations, please select your country/region of residence. If you do not select a country, we will assume you are from the United States. Select your Cookie Settings or view our Privacy Policy and Terms of Use.
Cookie Settings
Cookies and similar technologies are used on this website for proper function of the website, for tracking performance analytics and for marketing purposes. We and some of our third-party providers may use cookie data for various purposes. Please review the cookie settings below and choose your preference.
Used for the proper function of the website
Used for monitoring website traffic and interactions
Cookie Settings
Cookies and similar technologies are used on this website for proper function of the website, for tracking performance analytics and for marketing purposes. We and some of our third-party providers may use cookie data for various purposes. Please review the cookie settings below and choose your preference.
Strictly Necessary: Used for the proper function of the website
Performance/Analytics: Used for monitoring website traffic and interactions
This article was published as a part of the Data Science Blogathon. Introduction to EDA The main objective of this article is to cover the steps involved in Data pre-processing, Feature Engineering, and different stages of ExploratoryDataAnalysis, which is an essential step in any research analysis.
Introduction ExploratoryDataAnalysis is a method of evaluating or comprehending data in order to derive insights or key characteristics. EDA can be divided into two categories: graphical analysis and non-graphical analysis. EDA is a critical component of any data science or machine learning process.
ArticleVideo Book This article was published as a part of the Data Science Blogathon Introduction Exploratorydataanalysis is the first and most important phase. The post EDA: ExploratoryDataAnalysis With Python appeared first on Analytics Vidhya.
Introduction Exploratorydataanalysis is one of the best practices used in data science today. While starting a career in Data Science, people generally. The post ExploratoryDataAnalysis(EDA) from scratch in Python! appeared first on Analytics Vidhya.
ArticleVideo Book This article was published as a part of the Data Science Blogathon Overview Python Pandas library is becoming most popular between data scientists. The post EDA – ExploratoryDataAnalysis Using Python Pandas and SQL appeared first on Analytics Vidhya.
In this blog, we will discuss exploratorydataanalysis, also known as EDA, and why it is important. We will also be sharing code snippets so you can try out different analysis techniques yourself. EDA is an iterative process of conglomerative activities which include data cleaning, manipulation and visualization.
ArticleVideo Book This article was published as a part of the Data Science Blogathon. Overview Step by Step approach to Perform EDA Resources Like. The post Mastering ExploratoryDataAnalysis(EDA) For Data Science Enthusiasts appeared first on Analytics Vidhya.
Overview Understanding how EDA is done in Python Various steps involved in the ExploratoryDataAnalysis Performing EDA on a given dataset Introduction Exploratorydataanalysis popularly known as EDA is a process of performing some initial investigations on the dataset to discover the structure and the content of the given dataset.
The Importance of ExploratoryDataAnalysis (EDA) There are no shortcuts in a machine learning project lifecycle. The post A Beginner’s Guide to ExploratoryDataAnalysis (EDA) on Text Data (Amazon Case Study) appeared first on Analytics Vidhya.
The post ExploratoryDataAnalysis (EDA) on Lead Scoring Dataset appeared first on Analytics Vidhya. Leads are generally captured by tracking the user’s actions, like how much they visit the website, asking them to fill up some forms, etc. Leads […].
ArticleVideos This article was published as a part of the Data Science Blogathon. Introduction ExploratoryDataAnalysis is a process of examining or understanding. The post Introduction to ExploratoryDataAnalysis (EDA) appeared first on Analytics Vidhya.
This article was published as a part of the Data Science Blogathon What is EDA(Exploratorydataanalysis)? Exploratorydataanalysis is a great way of understanding and analyzing the data sets.
This article was published as a part of the Data Science Blogathon. Introduction ExploratoryDataAnalysis(EDA) is one of the most underrated and under-utilized. The post ExploratoryDataAnalysis – The Go-To Technique to Explore Your Data! appeared first on Analytics Vidhya.
ArticleVideo Book This article was published as a part of the Data Science Blogathon ExploratoryDataAnalysis, or EDA, is an important step in any. The post ExploratoryDataAnalysis (EDA) – A step by step guide appeared first on Analytics Vidhya.
ArticleVideo Book This article was published as a part of the Data Science Blogathon. Topic to be covered What is ExploratoryDataAnalysis What. The post Top Python Libraries to Automate ExploratoryDataAnalysis in 2021 appeared first on Analytics Vidhya.
ArticleVideo Book This article was published as a part of the Data Science Blogathon. Introduction ExploratoryDataAnalysis(EDA) is an important component as well. The post 20 Must-Know Pandas Function for ExploratoryDataAnalysis appeared first on Analytics Vidhya.
ArticleVideo Book This article was published as a part of the Data Science Blogathon Introduction Exploratorydataanalysis is an approach to analyzing data sets. The post ExploratoryDataAnalysis : A Beginners Guide To Perform EDA appeared first on Analytics Vidhya.
Table of Contents Introduction Working with dataset Creating loss dataframe Visualizations Analysis from Heatmap Overall Analysis Conclusion Introduction In this article, I am going to perform ExploratoryDataAnalysis on the Sample Superstore dataset.
ArticleVideo Book This article was published as a part of the Data Science Blogathon Photo by fauxels from Pexels What is ExploratoryDataAnalysis? Exploratory. The post ExploratoryDataAnalysis and Visualization Techniques in Data Science appeared first on Analytics Vidhya.
ArticleVideo Book This article was published as a part of the Data Science Blogathon Introduction ExploratoryDataAnalysis or EDA is a vital step in. The post Using Seaborn’s FacetGrid Based Methods for ExploratoryDataAnalysis appeared first on Analytics Vidhya.
Table of Contents Introduction Working with Dataset Visualizations Results after Analysis Measures to be taken to reduce Terrorism End-Note Introduction Source: [link] In this article, we are going to perform ExploratoryDataAnalysis on terrorism dataset to find out the hot zone of terrorism. […].
ArticleVideo Book This article was published as a part of the Data Science Blogathon Introduction ExploratoryDataAnalysis is a set of techniques that. The post How To Perform ExploratoryDataAnalysis -A Guide for Beginners appeared first on Analytics Vidhya.
The post Rapid-Fire EDA process using Python for ML Implementation appeared first on Analytics Vidhya. ArticleVideo Book Understand the ML best practice and project roadmap When a customer wants to implement ML(Machine Learning) for the identified business problem(s) after.
Introduction You might be wandering in the vast domain of AI, and may have come across the word ExploratoryDataAnalysis, or EDA for short. The post A Guide to ExploratoryDataAnalysis Explained to a 13-year-old! Well, what is it? Is it something important, if yes why?
ArticleVideo Book This article was published as a part of the Data Science Blogathon Hi all, this is my first blog hope you all like. The post Performing ExploratoryDataAnalysis with SAS and Python appeared first on Analytics Vidhya.
ArticleVideo Book This article was published as a part of the Data Science Blogathon Introduction Hello, Welcome to the world of EDA using Data Visualization. The post ExploratoryDataAnalysis using Data Visualization Techniques! appeared first on Analytics Vidhya.
ArticleVideo Book This article was published as a part of the Data Science Blogathon Introduction Many engineers have never worked in statistics or data science. The post Know the basics of ExploratoryDataAnalysis appeared first on Analytics Vidhya.
This article was published as a part of the Data Science Blogathon. We will perform a very basic level ExploratoryDataAnalysis (EDA) on the dataset and then make a recommendation […]. The post EDA and Recommendation System using The Big Bang Theory Show Dataset appeared first on Analytics Vidhya.
ArticleVideos Overview Sometimes during EDA(ExploratoryDataAnalysis) selecting or filtering data frames can be a tedious task Pandas DataFrame query() enables users to analyze. The post Introduction to Pandas DataFrame.query() function appeared first on Analytics Vidhya.
Introduction In the realm of data science, the initial step towards understanding and analyzing data involves a comprehensive exploratorydataanalysis (EDA). This process is pivotal for recognizing patterns, identifying anomalies, and establishing hypotheses.
ArticleVideo Book This article was published as a part of the Data Science Blogathon Introduction : As the title suggests, we will be exploring data. The post Walk Through of Haberman Cancer Survival Dataset ExploratoryDataAnalysis appeared first on Analytics Vidhya.
This article was published as a part of the Data Science Blogathon. Introduction Data visualization is crucial in Data Analytics. With exploratorydataanalysis (EDA), we gain insights into the hidden trends and patterns in a dataset that are useful for decision-making. are […].
Similarly, if a Data Scientist. The post An Efficient way of performing EDA- Hypothesis Generation appeared first on Analytics Vidhya. Introduction- One who knows how to improvise and can deal with all kinds of situations is a winner, right?
This means that you can use natural language prompts to perform advanced dataanalysis tasks, generate visualizations, and train machine learning models without the need for complex coding knowledge. Here’s an example of a Noteable plugin enabling ChatGPT to help perform geospatial analysis: Source: Noteable.io 3.
Photo by Luke Chesser on Unsplash EDA is a powerful method to get insights from the data that can solve many unsolvable problems in business. In the increasingly competitive world, understanding the data and taking quicker actions based on that help create differentiation for the organization to stay ahead!
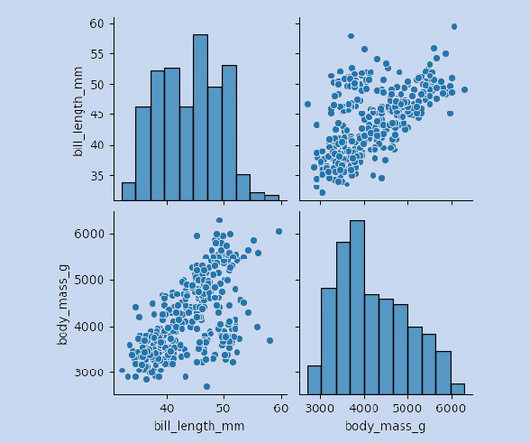
Summary: ExploratoryDataAnalysis (EDA) uses visualizations to uncover patterns and trends in your data. Histograms, scatter plots, and charts reveal relationships and outliers, helping you understand your data and make informed decisions. Imagine a vast, uncharted territory – your data set.
Summary: Python for Data Science is crucial for efficiently analysing large datasets. With numerous resources available, mastering Python opens up exciting career opportunities. Introduction Python for Data Science has emerged as a pivotal tool in the data-driven world. in 2022, according to the PYPL Index.
Discover the power of Python libraries for (partial) automation of ExploratoryDataAnalysis (EDA). These tools empower both seasoned Data Scientists and beginners to explore datasets efficiently, extracting meaningful insights without the usual time constraints. What are auto EDA libraires?
ExploratoryDataAnalysis on Stock Market Data Photo by Lukas Blazek on Unsplash ExploratoryDataAnalysis (EDA) is a crucial step in data science projects. It helps in understanding the underlying patterns and relationships in the data. quantile(0.25) q3 = df['Close'].quantile(0.75)
This article seeks to also explain fundamental topics in data science such as EDA automation, pipelines, ROC-AUC curve (how results will be evaluated), and Principal Component Analysis in a simple way. Act One: ExploratoryDataAnalysis — Automation The nuisance of repetitive tasks is something we programmers know all too well.
There are also plenty of data visualization libraries available that can handle exploration like Plotly, matplotlib, D3, Apache ECharts, Bokeh, etc. In this article, we’re going to cover 11 data exploration tools that are specifically designed for exploration and analysis. Output is a fully self-contained HTML application.
I discuss why I went from five to two plot types in my preliminary EDA. I also have created a Github for all code in this blog. The GitHub… Continue reading on MLearning.ai »
We organize all of the trending information in your field so you don't have to. Join 17,000+ users and stay up to date on the latest articles your peers are reading.
You know about us, now we want to get to know you!
Let's personalize your content
Let's get even more personalized
We recognize your account from another site in our network, please click 'Send Email' below to continue with verifying your account and setting a password.


Let's personalize your content