This site uses cookies to improve your experience. To help us insure we adhere to various privacy regulations, please select your country/region of residence. If you do not select a country, we will assume you are from the United States. Select your Cookie Settings or view our Privacy Policy and Terms of Use.
Cookie Settings
Cookies and similar technologies are used on this website for proper function of the website, for tracking performance analytics and for marketing purposes. We and some of our third-party providers may use cookie data for various purposes. Please review the cookie settings below and choose your preference.
Used for the proper function of the website
Used for monitoring website traffic and interactions
Cookie Settings
Cookies and similar technologies are used on this website for proper function of the website, for tracking performance analytics and for marketing purposes. We and some of our third-party providers may use cookie data for various purposes. Please review the cookie settings below and choose your preference.
Strictly Necessary: Used for the proper function of the website
Performance/Analytics: Used for monitoring website traffic and interactions
This article was published as a part of the Data Science Blogathon Snowflake is a cloud data platform that comes with a lot of unique features when compared to traditional on-premise RDBMS systems. In this tutorial, you will see the top 5 features that developers should know before implementing a solution on the Snowflake data […]. The post 5 Features Of Snowflake That Data Engineers Must Know appeared first on Analytics Vidhya.
Architects and interior designers have switched from pencils and papers to digital software and iPads, causing a significant change in design practices over the last few decades. Digital tools, as well as VR and AR technologies, are changing the way we learn, work, and live. And a whole new direction.
Much has been written about struggles of deploying machine learning projects to production. As with many burgeoning fields and disciplines, we don’t yet have a shared canonical infrastructure stack or best practices for developing and deploying data-intensive applications. This is both frustrating for companies that would prefer making ML an ordinary, fuss-free value-generating function like software engineering, as well as exciting for vendors who see the opportunity to create buzz around a new
Speaker: Ben Epstein, Stealth Founder & CTO | Tony Karrer, Founder & CTO, Aggregage
When tasked with building a fundamentally new product line with deeper insights than previously achievable for a high-value client, Ben Epstein and his team faced a significant challenge: how to harness LLMs to produce consistent, high-accuracy outputs at scale. In this new session, Ben will share how he and his team engineered a system (based on proven software engineering approaches) that employs reproducible test variations (via temperature 0 and fixed seeds), and enables non-LLM evaluation m
I have a confession to make—I’m a back-seat driver! When sitting in a taxi, I can’t help but grumble when the ride isn’t smooth, or the driver chooses the slowest lane of traffic. I have to fight the urge to take control. When it comes to shopping, I passively accept what is offered for sale. But my wife, who grew up in Asia where haggling is part of the culture, is different.
There are countless examples of big data transforming many different industries. It can be used for something as visual as reducing traffic jams, to personalizing products and services, to improving the experience in multiplayer video games. There is no disputing the fact that the collection and analysis of massive amounts of unstructured data has been a huge breakthrough.
This article was published as a part of the Data Science Blogathon Overview What is a Framework FrontEnd vs BackEnd What is Flask Framework Installation of Flask Creating our first Flask app Routing Static Route vs Dynamic Route HTML Injections HTML Escaping Hypertext Transfer Protocol GET and POST Methods What is a Framework? The framework […].
This article was published as a part of the Data Science Blogathon Overview What is a Framework FrontEnd vs BackEnd What is Flask Framework Installation of Flask Creating our first Flask app Routing Static Route vs Dynamic Route HTML Injections HTML Escaping Hypertext Transfer Protocol GET and POST Methods What is a Framework? The framework […].
Data is an indispensable resource for retailers. Today, most retail businesses understand that they must capitalize on digital data, but fewer know how to make the most of it. If these companies hope to reach their full potential, they must improve their data management. Data management is often a struggling.
Zan Armstrong, Ian Johnson, and Mike Freeman for Observable wrote a guide on analyzing time series data. Using an energy dataset, they show how asking different questions can lead to different findings and visualizations: These are stories about analyzing data that changes over time. While most of us don’t dig into data about energy day-to-day, we hope the feel of this data and these questions will be familiar to anyone who regularly faces questions like “what changed?
Kevlin Henney and I were riffing on some ideas about GitHub Copilot , the tool for automatically generating code base on GPT-3’s language model, trained on the body of code that’s in GitHub. This article poses some questions and (perhaps) some answers, without trying to present any conclusions. First, we wondered about code quality. There are lots of ways to solve a given programming problem; but most of us have some ideas about what makes code “good” or “bad.”
Francois Ajenstat. Chief Product Officer, Tableau. Spencer Czapiewski. October 8, 2021 - 11:41pm. October 12, 2021. It's more important than ever in this all digital, work from anywhere world for organizations to use data to make informed decisions. Speed, agility, and empowerment are crucial to thriving in this new environment. However, most organizations struggle to become data driven.
Speaker: Chris Townsend, VP of Product Marketing, Wellspring
Over the past decade, companies have embraced innovation with enthusiasm—Chief Innovation Officers have been hired, and in-house incubators, accelerators, and co-creation labs have been launched. CEOs have spoken with passion about “making everyone an innovator” and the need “to disrupt our own business.” But after years of experimentation, senior leaders are asking: Is this still just an experiment, or are we in it for the long haul?
Big data technology has been a highly valuable asset for many companies around the world. Countless companies are utilizing big data to improve many aspects of their business. Some of the best applications of data analytics and AI technology has been in the field of marketing. Data-Driven Marketing is More Important than Ever. The competition out there is fierce, so it is vital that you find ways to make your business stand out from the crowd.
This article was published as a part of the Data Science Blogathon Overview Data provides us with the power to analyze and forecast the events of the future. With each day, more and more companies are adopting data science techniques like predictive forecasting, clustering, and so on. While it’s very intriguing to keep learning about complex […].
Big data, specifically with the help of artificial intelligence (AI), empowers insurance companies to make better financial decisions. Data science can help mitigate fraudulent claims, enhance risk management, optimize customer support, and predict future events, among many other benefits. The result is higher profits for insurance companies and lower premiums.
Stacked area charts are a standard chart type that shows how a categorical distribution changes over time. There are packages that can do most of the work for you, but for a recent chart I found myself wanting more control over how the chart was drawn, which led me to drawing from scratch. Become a member for access to this — plus tutorials, courses, and guides.
In this new webinar, Tamara Fingerlin, Developer Advocate, will walk you through many Airflow best practices and advanced features that can help you make your pipelines more manageable, adaptive, and robust. She'll focus on how to write best-in-class Airflow DAGs using the latest Airflow features like dynamic task mapping and data-driven scheduling!
How I learned to stop worrying and love the field This blog covers all the core themes to starting your career in data science: ? Exploration vs Exploitation ? Getting a theoretical edge ? Building your professional portfolio ? Learning how to tell stories with data ❤️ Getting the pulse of the community The demand for data scientists has been steadily rising in the past decade, with industries like retail, medicine and finance claiming the lion’s share.
1.145 trillion megabytes! Unbelievably, this is the amount of data that was created every day in 2021. That’s a lot of data and a lot of work for experts working in the field of data science services. Amidst growing competition, businesses are under increasing pressure to come up with unique and more cost-effective ways to manufacture and market their products.
This article was published as a part of the Data Science Blogathon Overview In the current scenario, the Data science field is dominated by Python/R but there is another competition added not so long ago, Julia! which we will be exploring in this guide. The famous quote (motto) of Julia is – Looks like Python, runs […]. The post Introduction to Deep Learning in Julia appeared first on Analytics Vidhya.
Many software teams have migrated their testing and production workloads to the cloud, yet development environments often remain tied to outdated local setups, limiting efficiency and growth. This is where Coder comes in. In our 101 Coder webinar, you’ll explore how cloud-based development environments can unlock new levels of productivity. Discover how to transition from local setups to a secure, cloud-powered ecosystem with ease.
Artificial intelligence (AI) is transforming every sector and business function, resulting in a growing interest in it, its subcategories, and related areas such as machine learning and data science. While AI and automation might sound like the same concepts to many. But, in terms of procurement, both vary differently. Let’s.
Welcome to issue #163 of The Process , the newsletter for FlowingData members that looks closer at how the charts get made. I’m Nathan Yau and every month I collect tools and resources to help you make better charts. Here’s the good stuff for October. Become a member for access to this — plus tutorials, courses, and guides.
The leaderboard for the ‘trappiest’ chess openings — [link] The definitive guide to ranking the best chess traps using stats In this blog post, we will use cold hard stats (and Python) to calculate the best chess traps! ? ? What’s a chess trap? Let’s start with a definition: A trap is a position where a player is likely to play a move that when followed by the optimal response, results in a position where the player is likely to lose.
Jason Schumacher. Housing and Homelessness Lead at Tableau Foundation. Doug Minkler. Senior Manager of Product and Technology at Housing Connector. Kristin Adderson. October 29, 2021 - 9:45pm. October 30, 2021. Housing Connector was founded on a belief that no unit should sit vacant while there are individuals in need of a home. Housing Connector helps people like Chauncey Williamson , who spent more than two years applying to over 20 apartments, simply to be turned away each time because of a l
Large enterprises face unique challenges in optimizing their Business Intelligence (BI) output due to the sheer scale and complexity of their operations. Unlike smaller organizations, where basic BI features and simple dashboards might suffice, enterprises must manage vast amounts of data from diverse sources. What are the top modern BI use cases for enterprise businesses to help you get a leg up on the competition?
Satoshi Nakamoto introduced the world to bitcoin in 2008. Many people speculated that the virtual currency would never gain traction and become extinct. However, it has grown faster than even some of the staunchest supporters originally predicted. Advances in AI and machine learning technology have been important in setting the trend for bitcoin. It’s been over a decade since the cryptocurrencies were introduced to the world and since it has become increasingly popular.
This article was published as a part of the Data Science Blogathon This article was published as a part of the Data Science Blogathon Synopsis of Time Series Analysis A Time-Series represents a series of time-based orders. It would be Years, Months, Weeks, Days, Horus, Minutes, and Seconds A time series is an observation […]. The post A Comprehensive Guide to Time Series Analysis appeared first on Analytics Vidhya.
Facebook has announced Ego4D, a long-term project aimed at solving AI research challenges in “egocentric perception,” or first-person views. The goal is to teach AI systems to comprehend and interact with the world like humans do as opposed to in the third-person, omniscient way that most AI currently does. It’s.
Inspired by a graphic on Reddit , Jim Vallandingham expanded the format for all the shows. Search for a show and get a heatmap for average ratings by season and episode. See how your favorite show went into the dumpster at the end or withstood the test of time. Nice. The data comes from IMDb Datasets , which seems like a fun time series dataset to poke at.
Speaker: Mike Rizzo, Founder & CEO, MarketingOps.com and Darrell Alfonso, Director of Marketing Strategy and Operations, Indeed.com
Though rarely in the spotlight, marketing operations are the backbone of the efficiency, scalability, and alignment that define top-performing marketing teams. In this exclusive webinar led by industry visionaries Mike Rizzo and Darrell Alfonso, we’re giving marketing operations the recognition they deserve! We will dive into the 7 P Model —a powerful framework designed to assess and optimize your marketing operations function.
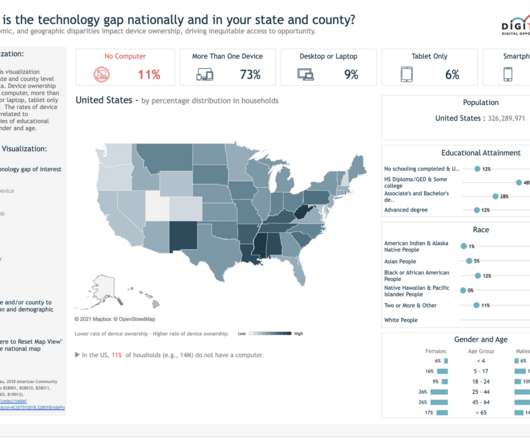
Channing Nesbitt. Co-lead of Tableau Foundation’s Racial Justice Data Initiative. Kristin Adderson. October 14, 2021 - 11:00pm. October 15, 2021. In the work to close the digital divide in the U.S., Digitunity’s Technology Gap Map TM has become a powerful visualization of the racial, socioeconomic, and geographic disparities impacting device ownership and driving inequitable access to opportunity.
Big data has touched almost every facet of our lives. It should be no surprise that the video gaming industry has been heavily influenced by developments in data technology. There are a number of potential opportunities to utilize big data in video games. One of the biggest benefits of integrating data analytics, AI and other technologies into video games is that it can help improve the user experience.
This article was published as a part of the Data Science Blogathon It was just past the midway mark of 2019 and the Internet casually decided to trick us as it normally does. An optical illusion went viral on Twitter which depicted a gray image that looked colored! Confused? Well, let’s dive deep in then! […]. The post Learn how to make your own Optical Illusion in Python appeared first on Analytics Vidhya.
Speaker: Jay Allardyce, Deepak Vittal, Terrence Sheflin, and Mahyar Ghasemali
As we look ahead to 2025, business intelligence and data analytics are set to play pivotal roles in shaping success. Organizations are already starting to face a host of transformative trends as the year comes to a close, including the integration of AI in data analytics, an increased emphasis on real-time data insights, and the growing importance of user experience in BI solutions.
We organize all of the trending information in your field so you don't have to. Join 17,000+ users and stay up to date on the latest articles your peers are reading.
You know about us, now we want to get to know you!
Let's personalize your content
Let's get even more personalized
We recognize your account from another site in our network, please click 'Send Email' below to continue with verifying your account and setting a password.


Let's personalize your content