This site uses cookies to improve your experience. To help us insure we adhere to various privacy regulations, please select your country/region of residence. If you do not select a country, we will assume you are from the United States. Select your Cookie Settings or view our Privacy Policy and Terms of Use.
Cookie Settings
Cookies and similar technologies are used on this website for proper function of the website, for tracking performance analytics and for marketing purposes. We and some of our third-party providers may use cookie data for various purposes. Please review the cookie settings below and choose your preference.
Used for the proper function of the website
Used for monitoring website traffic and interactions
Cookie Settings
Cookies and similar technologies are used on this website for proper function of the website, for tracking performance analytics and for marketing purposes. We and some of our third-party providers may use cookie data for various purposes. Please review the cookie settings below and choose your preference.
Strictly Necessary: Used for the proper function of the website
Performance/Analytics: Used for monitoring website traffic and interactions
This article was published as a part of the Data Science Blogathon Overview Data provides us with the power to analyze and forecast the events of the future. With each day, more and more companies are adopting data science techniques like predictive forecasting, clustering, and so on. While it’s very intriguing to keep learning about complex […].
Architects and interior designers have switched from pencils and papers to digital software and iPads, causing a significant change in design practices over the last few decades. Digital tools, as well as VR and AR technologies, are changing the way we learn, work, and live. And a whole new direction.
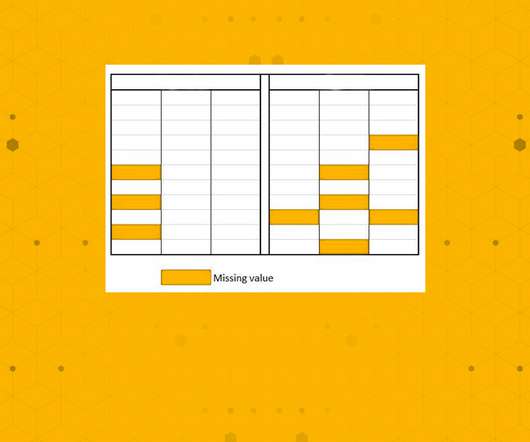
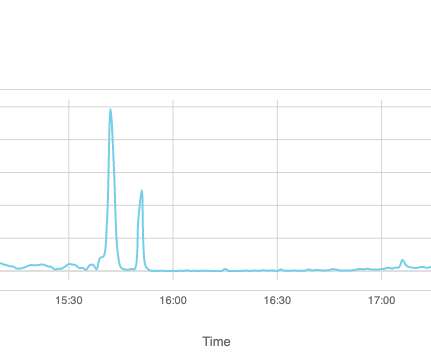
Zan Armstrong, Ian Johnson, and Mike Freeman for Observable wrote a guide on analyzing time series data. Using an energy dataset, they show how asking different questions can lead to different findings and visualizations: These are stories about analyzing data that changes over time. While most of us don’t dig into data about energy day-to-day, we hope the feel of this data and these questions will be familiar to anyone who regularly faces questions like “what changed?
Francois Ajenstat. Chief Product Officer, Tableau. Spencer Czapiewski. October 8, 2021 - 11:41pm. October 12, 2021. It's more important than ever in this all digital, work from anywhere world for organizations to use data to make informed decisions. Speed, agility, and empowerment are crucial to thriving in this new environment. However, most organizations struggle to become data driven.
Speaker: Ben Epstein, Stealth Founder & CTO | Tony Karrer, Founder & CTO, Aggregage
When tasked with building a fundamentally new product line with deeper insights than previously achievable for a high-value client, Ben Epstein and his team faced a significant challenge: how to harness LLMs to produce consistent, high-accuracy outputs at scale. In this new session, Ben will share how he and his team engineered a system (based on proven software engineering approaches) that employs reproducible test variations (via temperature 0 and fixed seeds), and enables non-LLM evaluation m
This article was published as a part of the Data Science Blogathon Overview In the current scenario, the Data science field is dominated by Python/R but there is another competition added not so long ago, Julia! which we will be exploring in this guide. The famous quote (motto) of Julia is – Looks like Python, runs […]. The post Introduction to Deep Learning in Julia appeared first on Analytics Vidhya.
There is no denying the fact that big data has become a critical asset to countless organizations all over the world. Many companies are storing data internally, which means that they have to be responsible for maintaining their own standards. Unfortunately, managing your own data server can be overwhelming. You have to make sure that your data is going to be secure from breaches and preserved from potential data outages.
Inspired by a graphic on Reddit , Jim Vallandingham expanded the format for all the shows. Search for a show and get a heatmap for average ratings by season and episode. See how your favorite show went into the dumpster at the end or withstood the test of time. Nice. The data comes from IMDb Datasets , which seems like a fun time series dataset to poke at.
138
138
Sign up to get articles personalized to your interests!
Data Science Current brings together the best content for data science professionals from the widest variety of thought leaders.
Inspired by a graphic on Reddit , Jim Vallandingham expanded the format for all the shows. Search for a show and get a heatmap for average ratings by season and episode. See how your favorite show went into the dumpster at the end or withstood the test of time. Nice. The data comes from IMDb Datasets , which seems like a fun time series dataset to poke at.
This article was published as a part of the Data Science Blogathon What is CNN? Convolutional Neural Network is a type of deep learning neural network that is artificial. It is employed in computer vision and image recognition. This procedure includes the following steps: OCR and image recognition Detecting objects in self-driving cars Social media face […].
AI technology has become a gamechanger for website development. Many developers are using AI to create better sites. However, it is also important to create sites with great AI features. AI-based solutions are becoming more and more popular among various industries. AI features can significantly improve the quality of your customer service and provide you with useful business insights.
Cloudflare describes how things looked from their point of view the day that Facebook, along with its other properties, went down. From the Border Gateway Protocol, which defines routing information: A BGP UPDATE message informs a router of any changes you’ve made to a prefix advertisement or entirely withdraws the prefix. We can clearly see this in the number of updates we received from Facebook when checking our time-series BGP database.
Speaker: Chris Townsend, VP of Product Marketing, Wellspring
Over the past decade, companies have embraced innovation with enthusiasm—Chief Innovation Officers have been hired, and in-house incubators, accelerators, and co-creation labs have been launched. CEOs have spoken with passion about “making everyone an innovator” and the need “to disrupt our own business.” But after years of experimentation, senior leaders are asking: Is this still just an experiment, or are we in it for the long haul?
Gabby Isaguirre. Brand Marketing Intern at Tableau, A Salesforce Company. Kristin Adderson. October 6, 2021 - 7:01am. September 17, 2021. The academic and professional worlds may not always be on the same page when it comes to equipping the incoming workforce with data skills. In fact, Tableau recently commissioned Forrester to investigate the data literacy gap, and according to The Great Data Literacy Gap: Demand for Data Skills Exceeds Supply , only 66% of surveyed academic decision-makers rat
This article was published as a part of the Data Science Blogathon Overview Say, you were setting up a gift shop and your supplier dumps all the toys that you asked for in a room. It’s going to look something like this. Total chaos! Now picture yourself standing in front of this huge pile of toys […]. The post A Beginner’s Guide to Feature Engineering – Everything You Need to Know!
Analytics technology has been invaluable to modern marketing. The market for web analytics is projected to be worth $9.11 billion by 2025. The utilization of analytics and big data in the marketing industry has played a massive role in this robust growth. One of the most important benefits of analytics in marketing is with PPC marketing. More companies are using analytics to expand the reach of their PPC campaigns and improve their ROI.
Spike maps use the height of spikes to encode data geographically. The format provides a similar effect to frequency trails where the layering looks 3-D-ish, except spikes are typically centered on an area instead of running parallel. Anyways, like most visualization methods with a name, there is an R package for spike maps by Timothée Giraud. If D3.js is your jam, there’s also a solution for that.
In this new webinar, Tamara Fingerlin, Developer Advocate, will walk you through many Airflow best practices and advanced features that can help you make your pipelines more manageable, adaptive, and robust. She'll focus on how to write best-in-class Airflow DAGs using the latest Airflow features like dynamic task mapping and data-driven scheduling!
Francois Ajenstat. Chief Product Officer, Tableau. Spencer Czapiewski. October 8, 2021 - 11:41pm. October 12, 2021. It's more important than ever in this all digital, work from anywhere world for organizations to use data to make informed decisions. Speed, agility, and empowerment are crucial to thriving in this new environment. However, most organizations struggle to become data driven.
This article was published as a part of the Data Science Blogathon Overview This comprehensive guide will instigate you to the world of Market Basket Analysis along with an implementation using Python on a dataset. Market Basket Analysis will help you to design different store Layouts. Introduction Nowadays Machine Learning is helping the Retail Industry in […].
There is no question that big data is very important for many businesses. Unfortunately, big data is only as useful as it is accurate. Data quality issues can cause serious problems in your big data strategy. Customers won’t always directly tell you the information your company needs to provide better products or services. However, their conversations on social media, most frequently posted topics and words, and responses to survey questions can reveal information essential to your company’s per
Aaron Steckelberg and Tik Root for The Washington Post provide a visual guide on how to protect your home from wildfire. It starts with an ember floating carefree in the air, and then the tour highlights actions you can take. Can’t wait for the guides on how to protect your home from flooding and/or how to dress for extreme temperatures. Tags: 3-d , Washington Post , wildfire.
Many software teams have migrated their testing and production workloads to the cloud, yet development environments often remain tied to outdated local setups, limiting efficiency and growth. This is where Coder comes in. In our 101 Coder webinar, you’ll explore how cloud-based development environments can unlock new levels of productivity. Discover how to transition from local setups to a secure, cloud-powered ecosystem with ease.
Jason McVay is a data scientist at Indigo Ag, an agriculture-tech company headquartered in Massachusetts. He has an education in environmental science and geography, with a Master’s degree in paleoecology. In this essay, Jason reflects on the value of thinking spatially about data, showing how his experience as a graduate student influences his role as a data scientist today.
We live in an era where choices are just endless. Especially with respect to Education! With a plethora of data science courses online, it is difficult to identify where to begin your journey from. How about beginning your MACHINE LEARNING Journey FREE of charge? Since its inception, Analytics Vidhya has been striving hard to explain […]. The post Would you like to start your Machine Learning journey for FREE?
Learn how genetic algorithms and machine learning can help hedge fund organizations manage a business. As well as bolster investor confidence and improve profitability. As a hedge fund shareholder, you certainly want the best for your organization, right? For instance, you want to generate effective AUM, NAV, and share value reports to improve investor confidence as a manager.
Gabby Isaguirre. Brand Marketing Intern at Tableau, A Salesforce Company. Kristin Adderson. October 6, 2021 - 7:01am. September 17, 2021. The academic and professional worlds may not always be on the same page when it comes to equipping the incoming workforce with data skills. In fact, Tableau recently commissioned Forrester to investigate the data literacy gap, and according to The Great Data Literacy Gap: Demand for Data Skills Exceeds Supply , only 66% of surveyed academic decision-makers rat
Large enterprises face unique challenges in optimizing their Business Intelligence (BI) output due to the sheer scale and complexity of their operations. Unlike smaller organizations, where basic BI features and simple dashboards might suffice, enterprises must manage vast amounts of data from diverse sources. What are the top modern BI use cases for enterprise businesses to help you get a leg up on the competition?
Click to learn more about author George Williams. In order to effectively back up all of data and resources with cloud disaster recovery, organizations need to craft a disaster recovery (DR) plan beforehand. This way, they will know exactly what to do and what to back up, and will save a lot of time and […]. The post What to Know Before Crafting a Cloud Disaster Recovery Plan appeared first on DATAVERSITY.
This article was published as a part of the Data Science Blogathon Image Source: [link] Overview of Lifecycle of Data Science Project With the increasing demand for Data Scientists, more people are willing to enter into this field. It has become very important to showcase the right skills for Data Science to stand out from the […]. The post Introduction to the Lifecycle of Data Science project appeared first on Analytics Vidhya.
Trust in AI must be earned. Ideally, business users or consumers that interact with a model and its output displayed in a dashboard should not need to question its authenticity. Unfortunately, we aren’t there yet, and it’s because there are different components to trust, some we have yet to address. One of these components is empathy. Many individuals do not fully trust AI due to the lack of empathy that is instilled into models.
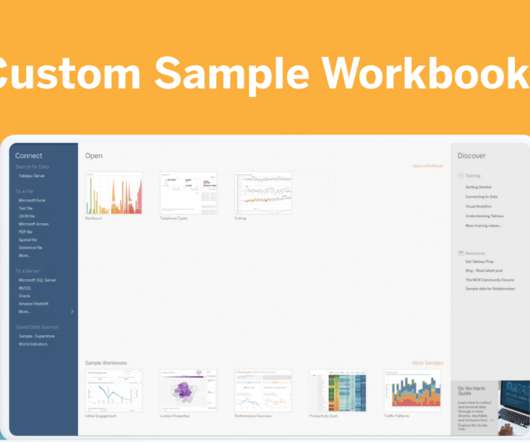
Matt Gizbert. Product Manager. Kristin Adderson. October 6, 2021 - 2:48am. October 6, 2021. How do you find inspiration when you’re staring at a blank canvas? There are so many great places for Tableau users to find inspiration, including the Tableau Community Forums, Tableau Public, and all the amazing blogs and websites where Tableau Zen Masters, Ambassadors, and partners publish their incredible work.
Speaker: Mike Rizzo, Founder & CEO, MarketingOps.com and Darrell Alfonso, Director of Marketing Strategy and Operations, Indeed.com
Though rarely in the spotlight, marketing operations are the backbone of the efficiency, scalability, and alignment that define top-performing marketing teams. In this exclusive webinar led by industry visionaries Mike Rizzo and Darrell Alfonso, we’re giving marketing operations the recognition they deserve! We will dive into the 7 P Model —a powerful framework designed to assess and optimize your marketing operations function.
Welcome to issue #160 of The Process , the newsletter for FlowingData members on how the charts get made. I’m Nathan Yau, and this week I imagine how one might start a freelance career in visualization these days — and probably provide terrible advice along the way. Become a member for access to this — plus tutorials, courses, and guides.
This article was published as a part of the Data Science Blogathon Overview Reinforcement learning is not just used for Robotics but now even in Data Science It has tons of applications and we will cover some of them in this guide. This comprehensive guide will introduce you to RL theory and implementation, all in Python […]. The post A Comprehensive Guide to Reinforcement Learning appeared first on Analytics Vidhya.
Click to learn more about author Peter Jackson. We have to make ethical decisions every day when working with data. The problem is, a lot of the time we might not realize when this is the case. Data professionals and organizations are often so focused on what can be done with data and at what scale, that […]. The post Data Ethics: What, Why Now, and Where Do We Start?
Matt Gizbert. Product Manager. Kristin Adderson. October 6, 2021 - 2:48am. October 6, 2021. How do you find inspiration when you’re staring at a blank canvas? There are so many great places for Tableau users to find inspiration, including the Tableau Community Forums, Tableau Public, and all the amazing blogs and websites where Tableau Zen Masters, Ambassadors, and partners publish their incredible work.
Speaker: Jay Allardyce, Deepak Vittal, Terrence Sheflin, and Mahyar Ghasemali
As we look ahead to 2025, business intelligence and data analytics are set to play pivotal roles in shaping success. Organizations are already starting to face a host of transformative trends as the year comes to a close, including the integration of AI in data analytics, an increased emphasis on real-time data insights, and the growing importance of user experience in BI solutions.
We organize all of the trending information in your field so you don't have to. Join 17,000+ users and stay up to date on the latest articles your peers are reading.
You know about us, now we want to get to know you!
Let's personalize your content
Let's get even more personalized
We recognize your account from another site in our network, please click 'Send Email' below to continue with verifying your account and setting a password.


Let's personalize your content