This site uses cookies to improve your experience. To help us insure we adhere to various privacy regulations, please select your country/region of residence. If you do not select a country, we will assume you are from the United States. Select your Cookie Settings or view our Privacy Policy and Terms of Use.
Cookie Settings
Cookies and similar technologies are used on this website for proper function of the website, for tracking performance analytics and for marketing purposes. We and some of our third-party providers may use cookie data for various purposes. Please review the cookie settings below and choose your preference.
Used for the proper function of the website
Used for monitoring website traffic and interactions
Cookie Settings
Cookies and similar technologies are used on this website for proper function of the website, for tracking performance analytics and for marketing purposes. We and some of our third-party providers may use cookie data for various purposes. Please review the cookie settings below and choose your preference.
Strictly Necessary: Used for the proper function of the website
Performance/Analytics: Used for monitoring website traffic and interactions
10 Most Used Tableau Functions • Is Domain Knowledge Important for Machine Learning? • ETL vs ELT: Data Integration Showdown • Free MLOps Crash Course for Beginners • 90% of Today’s Code is Written to Prevent Failure, and That’s a Problem.
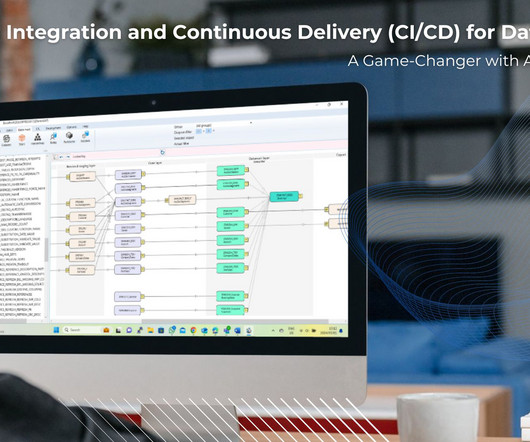
It also supports a wide range of data warehouses, analytical databases, data lakes, frontends, and pipelines/ETL. Frontends : AnalyticsCreator supports Power BI, Qlik Sense, Tableau, PowerPivot (Excel). Pipelines/ETL : It supports SQL Server Integration Packages (SSIS), Azure Data Factory 2.0 pipelines, Azure Data Bricks.
These tools provide data engineers with the necessary capabilities to efficiently extract, transform, and load (ETL) data, build data pipelines, and prepare data for analysis and consumption by other applications. 10 Tableau: Tableau is a widely used business intelligence and data visualization tool.
In Tableau 2021.1, Tableau has a breadth of connectors to allow you to plug into all of these solutions and analyze data at every step of its journey, supplying insight to users across your organization. Whether you are a new Azure SQL Database user or are migrating your on-premises SQL Server to the cloud, Tableau is there for you.
Key Skills Proficiency in SQL is essential, along with experience in data visualization tools such as Tableau or Power BI. Strong analytical skills and the ability to work with large datasets are critical, as is familiarity with data modeling and ETL processes.
Kuber Sharma Director, Product Marketing, Tableau Kristin Adderson August 22, 2023 - 12:11am August 22, 2023 Whether you're a novice data analyst exploring the possibilities of Tableau or a leader with years of experience using VizQL to gain advanced insights—this is your list of key Tableau features you should know, from A to Z.
Two tools that have significantly impacted the data analytics landscape are KNIME and Tableau. Tableau, owned by Salesforce, is a leading tool for data visualization, allowing users to create interactive dashboards and reports for better data understanding and decision-making.
In Tableau 2021.1, Tableau has a breadth of connectors to allow you to plug into all of these solutions and analyze data at every step of its journey, supplying insight to users across your organization. Whether you are a new Azure SQL Database user or are migrating your on-premises SQL Server to the cloud, Tableau is there for you.
All of this data is available to explore through our native connector in Tableau Desktop, Server, Online, and Prep. Prepare customer data with Tableau Prep Connector to Salesforce CDP. To realize maximum value from your data without constraining these resources, we introduce the Tableau Prep Native Connector to Salesforce CDP.
PowerBI, Tableau) and programming languages like R and Python in the form of bar graphs, scatter line plots, histograms, and much more. What are ETL and data pipelines? The data pipelines follow the Extract, Transform, and Load (ETL) framework. These visualizations can be done using platforms like software tools (e.g.,
20222024: As AI models required larger and cleaner datasets, interest in data pipelines, ETL frameworks, and real-time data processing surged. Today, data engineering is a major focal point, with organizations investing in robust ETL (Extract, Transform, Load) pipelines, real-time streaming solutions, and cloud-based data platforms.
Business Intelligence used to require months of effort from BI and ETL teams. Today, you have Tableau, empowering any analyst to create a report. More recently, we’ve seen Extract, Transform and Load (ETL) tools like Informatica and IBM Datastage disrupted by self-service data preparation tools.
Tools like Python (with pandas and NumPy), R, and ETL platforms like Apache NiFi or Talend are used for data preparation before analysis. Visualization libraries available in Python such as Matplotlib and Seaborn, and tools like Tableau and Power BI become crucial to telling stories that lead to insights.
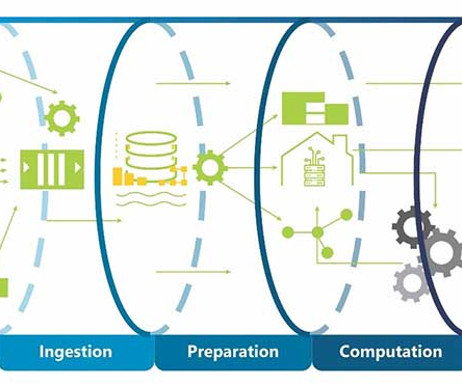
Big data pipelines operate similarly to traditional ETL (Extract, Transform, Load) pipelines but are designed to handle much larger data volumes. Data Ingestion: Data is collected and funneled into the pipeline using batch or real-time methods, leveraging tools like Apache Kafka, AWS Kinesis, or custom ETL scripts.
Reverse ETL tools. The modern data stack is also the consequence of a shift in analysis workflow, fromextract, transform, load (ETL) to extract, load, transform (ELT). Later, BI tools such as Chartio, Looker, and Tableau arrived on the data scene. A Note on the Shift from ETL to ELT. Extract, load, Transform (ELT) tools.
ETL (Extract, Transform, Load) Tools ETL tools are crucial for data integration processes. Here are some notable real-world examples of how businesses leverage BI tools: TableauTableau is one of the leading BI tools known for its powerful data visualization capabilities.
The popular tools, on the other hand, include Power BI, ETL, IBM Db2, and Teradata. SQL programming skills, specific tool experience — Tableau for example — and problem-solving are just a handful of examples. Professionals adept at this skill will be desirable by corporations, individuals and government offices alike.
Here are some of the best data preprocessing tools of 2023: Microsoft Power BI Tableau Trifacta Talend Toad Data Point Power Query Microsoft Power BI Microsoft Power BI is a comprehensive data preparation tool that allows users to create reports with multiple complex data sources.
Users can effortlessly extract data from sources like SQL Server, Excel, Tableau, and even social media platforms. Consider learning alternatives like SQL Server or Tableau through our Introduction to SQL Server and Introduction to Tableau courses. Is Alteryx an ETL tool? Is Alteryx similar to Tableau?
Tools like Tableau, Power BI, and Python libraries such as Matplotlib and Seaborn are commonly taught. Data Engineering : Building and maintaining data pipelines, ETL (Extract, Transform, Load) processes, and data warehousing. R : Often used for statistical analysis and data visualization.
Gain proficiency in data visualization tools like Tableau, Power BI, or Looker. Certification and Continuous Learning Pursue certifications like Microsoft Certified Data Analyst Associate, Tableau Certified Data Analyst, or Certified Business Intelligence Professional (CBIP) to demonstrate your expertise.
BI developer: A BI developer is responsible for designing and implementing BI solutions, including data warehouses, ETL processes, and reports. Database management: A BI professional should be able to design and manage databases, including data modeling, ETL processes, and data integration.
BI developer: A BI developer is responsible for designing and implementing BI solutions, including data warehouses, ETL processes, and reports. Database management: A BI professional should be able to design and manage databases, including data modeling, ETL processes, and data integration.
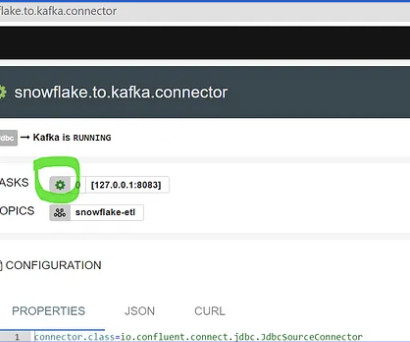
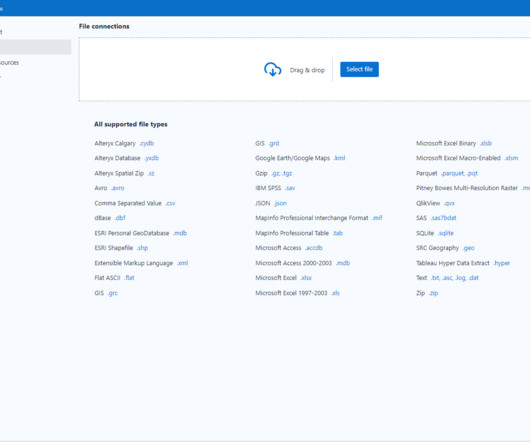
It is extremely labor intensive, and the team wants to automate it using Snowflake and Tableau. Snowflake can not natively read files on these services, so an ETL service is needed to upload the data. ETL applications are often expensive and require some level of expertise to run. Financial data is pulled from the ERP.
TableauTableau is a popular data visualization tool that enables users to create interactive dashboards and reports. Talend Talend is a data integration tool that enables users to extract, transform, and load (ETL) data across different sources. It helps streamline data processing tasks and ensures reliable execution.
They create data pipelines, ETL processes, and databases to facilitate smooth data flow and storage. Data Visualization: Matplotlib, Seaborn, Tableau, etc. ETL Tools: Apache NiFi, Talend, etc. Excel, Tableau, Power BI, SQL Server, MySQL, Google Analytics, etc. Read more to know. Big Data Technologies: Hadoop, Spark, etc.
This involves several key processes: Extract, Transform, Load (ETL): The ETL process extracts data from different sources, transforms it into a suitable format by cleaning and enriching it, and then loads it into a data warehouse or data lake. What Are Some Common Tools Used in Business Intelligence Architecture?
Familiarize yourself with data analysis techniques and tools. Learn BI technologies: Gain proficiency in popular BI tools and technologies such as Microsoft Power BI, Tableau, QlikView, or MicroStrategy.
Think of Tableau, Power BI, and QlikView. These are used to extract, transform, and load (ETL) data between different systems. This allows for it to be integrated with many different tools and technologies to improve data management and analysis workflows. Data integration tools allow for the combining of data from multiple sources.
Self-service analytics tools like Tableau help by democratizing the data analysis process, causing disruption to existing Extract, Transform, and Load (ETL) tools from the likes of Informatica and IBM Datastage.
Data Wrangling: Data Quality, ETL, Databases, Big Data The modern data analyst is expected to be able to source and retrieve their own data for analysis. Competence in data quality, databases, and ETL (Extract, Transform, Load) are essential. As you see, there are a number of reporting platforms as expected.
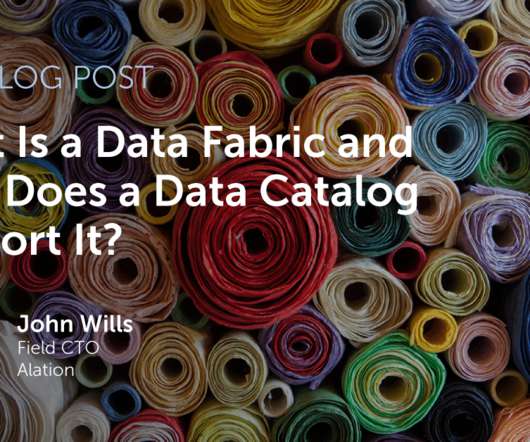
Alation’s approach to the Modern Data Stack This release enhancing data connectivity aligns with our previous release of Alation Anywhere for the MDS , which enables people using Tableau to understand and have confidence in the data they are exploring there. or “is this a legitimate business issue that I need to make my team aware of?”
Its use cases range from real-time analytics, fraud detection, messaging, and ETL pipelines. It can deliver a high volume of data with latency as low as two milliseconds. It is heavily used in various industries like finance, retail, healthcare, and social media.
ETL Tools Extract, Transform, Load (ETL) tools like Talend, Informatica, and Apache Nifi enable the integration and transformation of data from source systems into the dimensional model, ensuring that hierarchies are populated correctly.
Knowledge of Core Data Engineering Concepts Ensure one possess a strong foundation in core data engineering concepts, which include data structures, algorithms, database management systems, data modeling , data warehousing , ETL (Extract, Transform, Load) processes, and distributed computing frameworks (e.g., Hadoop, Spark).
These tasks often go through several stages, similar to the ETL process (Extract, Transform, Load). This led to the creation of a Tableau dashboard that helps users identify non-compliant licenses for timely resolution. If you want more about this use case, please check this link.
Data Warehousing and ETL Processes What is a data warehouse, and why is it important? Explain the Extract, Transform, Load (ETL) process. The ETL process involves extracting data from source systems, transforming it into a suitable format or structure, and loading it into a data warehouse or target system for analysis and reporting.
Matillion Matillion is a complete ETL tool that integrates with an extensive list of pre-built data source connectors, loads data into cloud data environments such as Snowflake, and then performs transformations to make data consumable by analytics tools such as Tableau and PowerBI.
ETL Tools Informatica, Talend, and Apache Airflow enable the extraction of data from source systems, transformation into the desired format, and loading into the dimensional model. These tools help streamline the design process and ensure consistency. These tools are essential for populating fact tables with accurate and timely data.
Understanding ETL (Extract, Transform, Load) processes is vital for students. Visualisation Tools Familiarity with tools such as Tableau, Power BI, and D3.js Data Integration Tools Technologies such as Apache NiFi and Talend help in the seamless integration of data from various sources into a unified system for analysis.
Matillion Matillion is a complete ETL tool that integrates with an extensive list of pre-built data source connectors, loads data into cloud data environments such as Snowflake, and then performs transformations to make data consumable by analytics tools such as Tableau and PowerBI.
Alation partners such as Dataiku, Trifacta, and Tableau are perfect examples. On the process side, DataOps is essentially an agile and unified approach to building data movements and transformation pipelines (think streaming and modern ETL). See Gartner’s “ How DataOps Amplifies Data and Analytics Business Value ”).
database permissions, ETL capability, processing, etc.), it has to be done using custom SQL in Tableau? Hopefully, you don’t run into this scenario because joining and querying multiple tables in Tableau using custom SQL is not recommended due to its impact on performance.
Frontends : Kompatibel mit Tools wie Power BI, Qlik Sense und Tableau. Pipelines/ETL : Unterstützt Technologien wie SQL Server Integration Services und Azure Data Factory. Vielfältige Unterstützung: Kompatibel mit verschiedenen Datenbankmanagementsystemen wie MS SQL Server und Azure Synapse Analytics.
We organize all of the trending information in your field so you don't have to. Join 17,000+ users and stay up to date on the latest articles your peers are reading.
You know about us, now we want to get to know you!
Let's personalize your content
Let's get even more personalized
We recognize your account from another site in our network, please click 'Send Email' below to continue with verifying your account and setting a password.


Let's personalize your content