This site uses cookies to improve your experience. To help us insure we adhere to various privacy regulations, please select your country/region of residence. If you do not select a country, we will assume you are from the United States. Select your Cookie Settings or view our Privacy Policy and Terms of Use.
Cookie Settings
Cookies and similar technologies are used on this website for proper function of the website, for tracking performance analytics and for marketing purposes. We and some of our third-party providers may use cookie data for various purposes. Please review the cookie settings below and choose your preference.
Used for the proper function of the website
Used for monitoring website traffic and interactions
Cookie Settings
Cookies and similar technologies are used on this website for proper function of the website, for tracking performance analytics and for marketing purposes. We and some of our third-party providers may use cookie data for various purposes. Please review the cookie settings below and choose your preference.
Strictly Necessary: Used for the proper function of the website
Performance/Analytics: Used for monitoring website traffic and interactions
Synapse Real-Time Intelligence: Real-Time Intelligence in Synapse provides a robust solution to gain insights and visualize event-driven scenarios and streaming data logs. PowerBI: PowerBI, integrated within Microsoft Fabric, is a leading Business Intelligence tool that facilitates advanced data visualization and reporting.
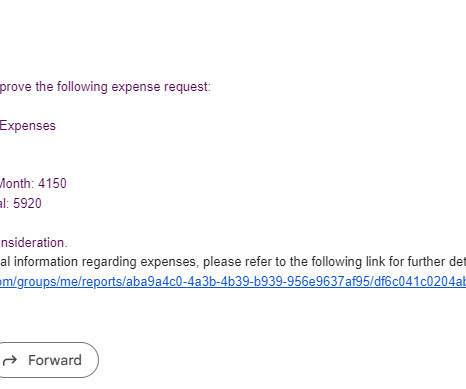
By integrating Power Automate workflows with your PowerBI report, you can develop robust business solutions and automate processes such as updating data, sending data driven alerts , requesting approvals, and more. In this blog, we will walk you through how to integrate Power Automate workflows with PowerBI.
When thinking about PowerBI , the platform’s visuals and report side immediately come to mind. Data modeling in PowerBI has a major impact on the performance of reports and should be considered a substantial learning milestone for new PowerBI developers. Why Does Data Modeling Matter in PowerBI?
This aspect can be applied well to Process Mining, hand in hand with BI and AI. The Event Log Data Model for Process Mining Process Mining as an analytical system can very well be imagined as an iceberg. SAP ERP), the extraction of the data and, above all, the data modeling for the event log.
Microsoft Fabric combines multiple elements into a single platform – Image courtesy of Microsoft The contribution of PowerBI The integration of Microsoft PowerBI and Microsoft Fabric offers a powerful combination for organizations seeking comprehensive data analytics and insights.
Organizations spend lots of money ensuring they have the right resources to support their PowerBI platform to ensure a good developer and end-user experience. This app equips PowerBI admins to be able to monitor their capacity’s resources and identify issues and areas for improvement.
While Data Science Applications have more raw data, BI applications get their well prepared star schema galaxy models, and Process Mining apps get normalized event logs. The post Data Mesh Architecture on Cloud for BI, Data Science and Process Mining appeared first on Data Science Blog.
Key Skills Proficiency in SQL is essential, along with experience in data visualization tools such as Tableau or PowerBI. Many experts recommend actively participating in discussions, attending virtual events, and connecting with data science professionals to boost your visibility.
Carolina Soto opened the event with an introduction to Munich Re. Our speakers provided valuable insights: Elena Wetzel and Komal Rizwan showcased the power of data integration with Databricks & PowerBI.
QGIS, Microsoft's PowerBI, Tableau, and Jupyter notebooks also facilitated many interesting visualizations, particularly for solvers with less programming experience. Within PowerBI, we made a simple relational data model from the datasets by linking them together along common coordinates.
Tools like Tableau, PowerBI, and Python libraries such as Matplotlib and Seaborn are commonly taught. Career Support Some bootcamps include job placement services like resume assistance, mock interviews, networking events, and partnerships with employers to aid in job placement.
Ateken Abla July 9, 2024 - 7:30pm Danika Harrod Marketing Manager, Community Content & Events, Tableau How did Paul go from Tableau beginner to winning Iron Viz at his first attempt? I’ve never tried to create something like that in PowerBI.” With PowerBI your actions are largely predetermined.
Effective Techniques for Data Visualization Let’s dive into the world of PowerBI to explore its features and learn some useful data visualization tips and tricks for data visualization. PowerBI, a business analytics tool developed by Microsoft, offers interactive visualizations with self-service business intelligence capabilities.
This can be applied to data visualization tools such as PowerBI and others. So don’t hold back, go out and attend industry events, and conferences, and connect with people on LinkedIn — don’t forget to add a note if you don’t know them! -, and reach out to friends and family who may be able to help you.
” and “How to build dynamic control charts in PowerBI for any complex system” To conclude the conference, we held a panel discussion on the topic of “Stories of entering the profession”, where participants shared their stories of entering, and practical advice on changing roles.
Check out this course and learn PowerBI today! Additionally, the expense and harm to one’s reputation caused by a SaaS data event much outweigh anything invested in a SaaS-focused security posture. Looking to take your data analytics and visualization to the next level?
Some of these new tools use AI to predict events more accurately by employing predictive analytics to identify subtle relationships between even seemingly unrelated variables. Predictive analytics is the use of data and AI-powered algorithms to help analysts forecast the future and better predict business outcomes.
EVENT — ODSC East 2024 In-Person and Virtual Conference April 23rd to 25th, 2024 Join us for a deep dive into the latest data science and AI trends, tools, and techniques, from LLMs to data analytics and from machine learning to responsible AI. Interested in attending an ODSC event? Learn more about our upcoming events here.
Popular tools like PowerBI, Tableau, and Google Data Studio offer unique features for Data Analysis. These tools allow organisations to uncover key metrics, helping drive strategic actions based on past events. Microsoft PowerBI Microsoft PowerBI is one of the most popular and widely used Descriptive Analytics tools.
EVENT — ODSC East 2024 In-Person and Virtual Conference April 23rd to 25th, 2024 Join us for a deep dive into the latest data science and AI trends, tools, and techniques, from LLMs to data analytics and from machine learning to responsible AI. Interested in attending an ODSC event? Learn more about our upcoming events here.
It’s for good reason too because automation and powerful machine learning tools can help extract insights that would otherwise be difficult to find even by skilled analysts. The entire process is also achieved much faster, boosting not just general efficiency but an organization’s reaction time to certain events, as well.
Diagnostic analytics: Diagnostic analytics helps pinpoint the reason an event occurred. To pursue a data science career, you need a deep understanding and expansive knowledge of machine learning and AI. Manufacturers can analyze a failed component on an assembly line and determine the reason behind its failure.
You can learn how to manipulate data with Python, and make a world-class visual dashboard with PowerBI, but if you lack the soft skills necessary to get your point across to stakeholders, then those hours of work aren’t going to mean much. From practical training, hands-on workshops, networking events, and more.
However, individuals with degrees in other fields, such as business or economics, can also pursue a career in BI with the right technical skills and experience. Certifications: Certifications in BI tools and technologies, such as Microsoft PowerBI, Tableau, or Oracle BI, can help demonstrate expertise and advance a BI career.
However, individuals with degrees in other fields, such as business or economics, can also pursue a career in BI with the right technical skills and experience. Certifications: Certifications in BI tools and technologies, such as Microsoft PowerBI, Tableau, or Oracle BI, can help demonstrate expertise and advance a BI career.
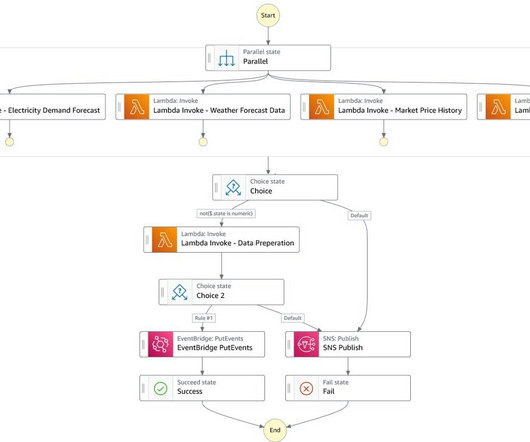
Amazon EventBridge to trigger the data ingestion and ML pipeline on a schedule and in response to events. Power price, weather, and load forecast data is received in JSON and character delimited files. This construct provides a fully event-driven workflow. In the following sections, we discuss the workflow in more detail.
Because they are the most likely to communicate data insights, they’ll also need to know SQL, and visualization tools such as PowerBI and Tableau as well. Some of the tools and techniques unique to business analysts are pivot tables, financial modeling in Excel, PowerBI Dashboards for forecasting, and Tableau for similar purposes.
In this blog, I’ll share my experience attending, highlight some exciting awards, and unpack all the exciting updates from the event. BI Tool Integration: A new dbt Semantic Layer connection to PowerBI is coming soon! The venue was great—a Vegas hotel with an entire floor dedicated exclusively to the conference.
Business Intelligence Tools Platforms like Tableau or PowerBI allow businesses to visualise complex data sets related to pricing strategies, making it easier to identify trends and insights that inform decision-making.
Tools Commonly Used Business Intelligence Platforms: Tableau, Microsoft PowerBI, Qlik Sense, Google Data Studio (Looker Studio) Programming Libraries: Matplotlib, Seaborn (Python); ggplot2 (R); D3.js Analyse -> Visualise -> Question -> Analyse Again -> Refine Visualisation.
KPIs for predictive maintenance include: Equipment downtime Mean time between failures (MTBF) Mean time to repair (MTTR) All of these KPIs can be measured by tracking the amount of time that equipment is not in use due to maintenance or repair, as well as the frequency and duration of maintenance and repair events.
A user sends a question (NLQ) as a JSON event. The company’s Data & Analytics team regularly receives client requests for unique reports, metrics, or insights, which require custom development. The following figure illustrates the core architecture for the NLQ capability. If it finds any, it skips to Step 6.
Here are some of the things we’re still talking about from the event, which offered ways to grant more data-related wishes — using marketplaces, products, mesh, fabric, AI, and active governance — than the genie of Aladdin’s lamp could accommodate.
Diagnostic Analytics Diagnostic analytics goes a step further by explaining why certain events occurred. Predictive Analytics Predictive analytics involves using statistical algorithms and Machine Learning techniques to forecast future events based on historical data.
These tables are called “factless fact tables” or “junction tables” They are used for modelling many-to-many relationships or for capturing timestamps of events. A star schema forms when a fact table combines with its dimension tables. This schema serves as the foundation of dimensional modeling.
Step 2: Analyze the Data Once you have centralized your data, use a business intelligence tool like Sigma Computing , PowerBI , Tableau , or another to craft analytics dashboards. It also leads to more company-wide collaboration and cuts unnecessary organizational expenses.
Here are a few of our most popular certifications: Snowflake Data Cloud AWS Dataiku dbt Fivetran Tableau Sigma Computing PowerBI Plus many more! Additionally, folks can earn even more swag for helping with special projects, being in the right place at the right time, or attending events.
Diagnostic Analysis : This method is used to understand the reasons behind specific trends or events. Some of the popular ones include: Excel : A basic yet powerful tool for organising and analysing data. Tableau and PowerBI : Visual tools that help present data in interactive charts and dashboards.
Financial Analysts can leverage tools like Tableau, PowerBI, or Excel to create visually compelling data representations, enabling stakeholders to grasp key insights at a glance. Network and relationship building Attend industry conferences, seminars, and networking events to expand your professional contacts.
Operational Risks: Uncover operational risks such as data loss or failures in the event of an unforeseen outage or disaster. Users can also utilize their own BI tooling, PowerBI, or Sigma Computing to create monitoring dashboards.
Students should understand the concepts of event-driven architecture and stream processing. Visualisation Tools Familiarity with tools such as Tableau, PowerBI, and D3.js Knowledge of RESTful APIs and authentication methods is essential. Once data is collected, it needs to be stored efficiently.
PowerBI is surprisingly popular as well, possibly for its focus on business and applications, making it more commonly used by even non-tech-savvy individuals. Data Visualization Data scientists may be expected to know some basic data visualization to help tell a story with their data and algorithms.
Descriptive Analytics This explains past events ; businesses use it to track sales, website traffic, or customer feedback. Tableau and PowerBI : Visualisation tools that create interactive dashboards and reports. Types of Data Analytics Data Analytics includes different types, each serving a unique purpose.
It also integrates deeply with PowerBI and Azure Machine Learning, providing a seamless workflow from data ingestion to advanced analytics. Consider joining local or online communities, such as Meetup groups, where you can engage with like-minded professionals and stay informed about industry events and opportunities.
We organize all of the trending information in your field so you don't have to. Join 17,000+ users and stay up to date on the latest articles your peers are reading.
You know about us, now we want to get to know you!
Let's personalize your content
Let's get even more personalized
We recognize your account from another site in our network, please click 'Send Email' below to continue with verifying your account and setting a password.


Let's personalize your content