This site uses cookies to improve your experience. To help us insure we adhere to various privacy regulations, please select your country/region of residence. If you do not select a country, we will assume you are from the United States. Select your Cookie Settings or view our Privacy Policy and Terms of Use.
Cookie Settings
Cookies and similar technologies are used on this website for proper function of the website, for tracking performance analytics and for marketing purposes. We and some of our third-party providers may use cookie data for various purposes. Please review the cookie settings below and choose your preference.
Used for the proper function of the website
Used for monitoring website traffic and interactions
Cookie Settings
Cookies and similar technologies are used on this website for proper function of the website, for tracking performance analytics and for marketing purposes. We and some of our third-party providers may use cookie data for various purposes. Please review the cookie settings below and choose your preference.
Strictly Necessary: Used for the proper function of the website
Performance/Analytics: Used for monitoring website traffic and interactions
This article was published as a part of the Data Science Blogathon What is HypothesisTesting? Any data science project starts with exploring the data. When we perform an analysis on a sample through exploratorydataanalysis and inferential statistics we get information about the sample.
In this blog, we will discuss exploratorydataanalysis, also known as EDA, and why it is important. We will also be sharing code snippets so you can try out different analysis techniques yourself. EDA is an iterative process of conglomerative activities which include data cleaning, manipulation and visualization.
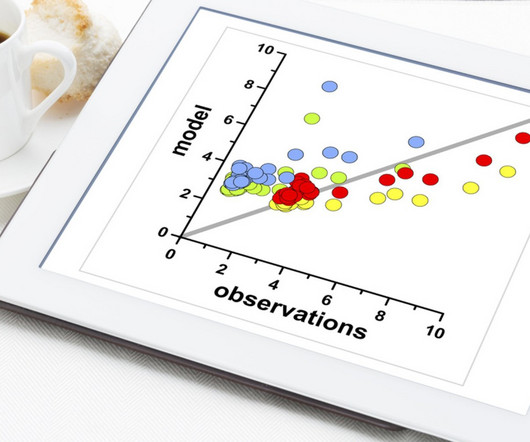
Photo by Joshua Sortino on Unsplash Dataanalysis is an essential part of any research or business project. Before conducting any formal statistical analysis, it’s important to conduct exploratorydataanalysis (EDA) to better understand the data and identify any patterns or relationships.
They employ statistical and mathematical techniques to uncover patterns, trends, and relationships within the data. Data scientists possess a deep understanding of statistical modeling, data visualization, and exploratorydataanalysis to derive actionable insights and drive business decisions.
Statistics Understand descriptive statistics (mean, median, mode) and inferential statistics (hypothesistesting, confidence intervals). These concepts help you analyse and interpret data effectively. Its flexibility allows you to produce high-quality graphs and charts, making it perfect for exploratoryDataAnalysis.
HypothesisTesting in Action: We learned how to formulate a null hypothesis (no difference exists) and an alternative hypothesis (a difference exists) and use statistical tests to evaluate their validity. This allows us to make generalizations about populations based on samples.
Overview of Typical Tasks and Responsibilities in Data Science As a Data Scientist, your daily tasks and responsibilities will encompass many activities. You will collect and clean data from multiple sources, ensuring it is suitable for analysis. This step ensures that all relevant data is available in one place.
Data Science Bootcamp Pickl.AI This bootcamp includes a dedicated Statistics module covering essential topics like types of variables, measures of central tendency, histograms, hypothesistesting, and more. You will learn by practising Data Scientists. Data Science Job Guarantee Course Pickl.AI
Statsmodels Allows users to explore data, estimate statistical models, and perform statistical tests. It is particularly useful for regression analysis and hypothesistesting. Pingouin A library designed for statistical analysis, providing a comprehensive collection of statistical tests.
Prescriptive Analysis : Significantly, the use of Prescriptive Analysis helps in prescribing the best possible outcome for assessing datasets. ExploratoryDataAnalysis : Significantly, the use of exploratorydataanalysis in Statistics studies the datasets to highlight the major features of the data.
F1 :: 2024 Strategy Analysis Poster ‘The Formula 1 Racing Challenge’ challenges participants to analyze race strategies during the 2024 season. They will work with lap-by-lap data to assess how pit stop timing, tire selection, and stint management influence race performance.
ExploratoryDataAnalysis (EDA) ExploratoryDataAnalysis (EDA) is an approach to analyse datasets to uncover patterns, anomalies, or relationships. The primary purpose of EDA is to explore the data without any preconceived notions or hypotheses.
Here are some key areas often assessed: Programming Proficiency Candidates are often tested on their proficiency in languages such as Python, R, and SQL, with a focus on data manipulation, analysis, and visualization. However, there are a few fundamental principles that remain the same throughout.
It involves handling missing values, correcting errors, removing duplicates, standardizing formats, and structuring data for analysis. ExploratoryDataAnalysis (EDA): Using statistical summaries and initial visualisations (yes, visualisation plays a role within analysis!)
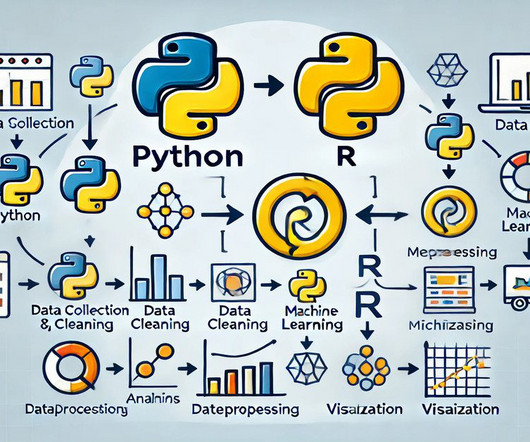
Visualisation and Reporting Python’s Matplotlib and Seaborn libraries are excellent for creating a variety of visualisations, especially during exploratorydataanalysis. Statistical Analysis and Testing R’s rich ecosystem for hypothesistesting, regression modelling, and Bayesian analysis makes it ideal for statistical tasks.
R’s data manipulation capabilities make cleaning and preprocessing data easy before further analysis. · Statistical Analysis: R has a rich ecosystem of packages for statistical analysis.
The process of conducting Regression Analysis typically involves several steps: Step 1: Data Collection: Gather relevant data for both dependent and independent variables. This data can come from various sources such as surveys, experiments, or historical records.
Data Collection: Based on the question or problem identified, you need to collect data that represents the problem that you are studying. ExploratoryDataAnalysis: You need to examine the data for understanding the distribution, patterns, outliers and relationships between variables.
Their primary responsibilities include: Data Collection and Preparation Data Scientists start by gathering relevant data from various sources, including databases, APIs, and online platforms. They clean and preprocess the data to remove inconsistencies and ensure its quality.
I conducted thorough data validation, collaborated with stakeholders to identify the root cause, and implemented corrective measures to ensure data integrity. I would perform exploratorydataanalysis to understand the distribution of customer transactions and identify potential segments.
In Inferential Statistics, you can learn P-Value , T-Value , HypothesisTesting , and A/B Testing , which will help you to understand your data in the form of mathematics. For DataAnalysis you can focus on such topics as Feature Engineering , Data Wrangling , and EDA which is also known as ExploratoryDataAnalysis.
Deep Learning : A subset of Machine Learning that uses Artificial Neural Networks with multiple hidden layers to learn from complex, high-dimensional data. ExploratoryDataAnalysis (EDA): Analysing and visualising data to discover patterns, identify anomalies, and test hypotheses.
As an example for catalogue data, it’s important to check if the set of mandatory fields like product title, primary image, nutritional values, etc. are present in the data. So, we need to build a verification layer that runs based on a set of rules to verify and validate data before preparing it for model training.
We organize all of the trending information in your field so you don't have to. Join 17,000+ users and stay up to date on the latest articles your peers are reading.
You know about us, now we want to get to know you!
Let's personalize your content
Let's get even more personalized
We recognize your account from another site in our network, please click 'Send Email' below to continue with verifying your account and setting a password.


Let's personalize your content