This site uses cookies to improve your experience. To help us insure we adhere to various privacy regulations, please select your country/region of residence. If you do not select a country, we will assume you are from the United States. Select your Cookie Settings or view our Privacy Policy and Terms of Use.
Cookie Settings
Cookies and similar technologies are used on this website for proper function of the website, for tracking performance analytics and for marketing purposes. We and some of our third-party providers may use cookie data for various purposes. Please review the cookie settings below and choose your preference.
Used for the proper function of the website
Used for monitoring website traffic and interactions
Cookie Settings
Cookies and similar technologies are used on this website for proper function of the website, for tracking performance analytics and for marketing purposes. We and some of our third-party providers may use cookie data for various purposes. Please review the cookie settings below and choose your preference.
Strictly Necessary: Used for the proper function of the website
Performance/Analytics: Used for monitoring website traffic and interactions
Summary: This blog dives into the most promising PowerBI projects, exploring advanced data visualization, AI integration, IoT & blockchain analytics, and emerging technologies. Introduction to PowerBI Project s The world of Data Analysis is constantly evolving, and PowerBI stands at the forefront of this transformation.
Summary : Microsoft Fabric is an end-to-end Data Analytics platform designed for integration, processing, and advanced insights, while PowerBI excels in creating interactive visualisations and reports. Key Takeaways Microsoft Fabric is a full-scale data platform, while PowerBI focuses on visualising insights.
Summary: PowerBI is a business intelligence tool that transforms raw data into actionable insights. PowerBI enhances decision-making by providing interactive dashboards and reports that are accessible to both technical and non-technical users. What Is PowerBI?
Summary: PowerBI alternatives like Tableau, Qlik Sense, and Zoho Analytics provide businesses with tailored Data Analysis and Visualisation solutions. Introduction PowerBI has become one of the most popular business intelligence (BI) tools, offering powerful Data Visualisation, reporting, and decision-making features.
Instead, open source BI software offers a range of powerful tools and features that can be customized and integrated seamlessly into existing workflows, making it easier than ever for businesses to unlock valuable insights and drive informed decision-making. What is open source business intelligence?
These models process vast amounts of text data to learn language patterns, enabling them to respond to queries, summarize information, or even generate complex SQL queries based on natural language inputs. Generative AI for Data Analytics – Top 7 Tools to Leverage 1.
Businesses project planning is key to success and now they are increasingly rely on data projects to make informed decisions, enhance operations, and achieve strategic goals. Engage stakeholders early and often Stakeholders are a goldmine of information. Project management is crucial in 2025 for any business.
It plays a crucial role in decision-making processes across industries by simplifying complex information, facilitating real-time monitoring, and improving communication among stakeholders. In an era where attention spans are dwindling—averaging around 8 seconds—visualizations help convey information quickly and effectively.
Then, once you’re ready to start your analysis, spreadsheets make it easy to point and click your way to a completed, informative analysis — no ‘coding’ required. But spreadsheets aren’t built for large datasets, or complex analytics, or repeatable processes. Great Power. Ownership and flexibility.
Matt Turck, an AI and data investor, calls it “ the ‘datafication’ of everything ” — as more of the world comes online, it becomes possible to analyze, catalog and turn information into a format analysts, and AI, can break down. Natural Language Processing and Report Generation.
In addition to Business Intelligence (BI), Process Mining is no longer a new phenomenon, but almost all larger companies are conducting this data-driven process analysis in their organization. It is therefore hardly surprising that some process mining tools are actually just a plugin for PowerBI, Tableau or Qlik.
In this era of information overload, utilizing the power of data and technology has become paramount to drive effective decision-making. It enables organizations to make informed choices, capitalize on emerging trends, and seize growth opportunities with confidence. What is decision intelligence?
Visualization libraries available in Python such as Matplotlib and Seaborn, and tools like Tableau and PowerBI become crucial to telling stories that lead to insights. The data analyst focuses on interpreting data and presenting the information in a clear, visual format to help businesses make better decisions.
Summary: Descriptive Analytics tools transform historical data into visual reports, helping businesses identify trends and improve decision-making. Popular tools like PowerBI, Tableau, and Google Data Studio offer unique features for Data Analysis. What is Descriptive Analytics?
How effectively and efficiently an organization can conduct data analytics is determined by its data strategy and data architecture , which allows an organization, its users and its applications to access different types of data regardless of where that data resides.
Using tools like PowerBI, Tableau, and Grafana, organisations can analyse real-time IoT data, optimise operations, and enhance decision-making while addressing security, scalability, and visualisation challenges. Hence, it enables businesses to enhance efficiency, optimise operations, and make informed decisions.
These tools transform raw data into actionable insights, enabling businesses to make informed decisions, improve operational efficiency, and adapt to market trends effectively. Introduction Business Intelligence (BI) tools are essential for organizations looking to harness data effectively and make informed decisions.
By the end, you’ll learn how to leverage AI to simplify data handling and make informed decisions with ease. Predictive Models : AI-powered forecasting functions, such as FORECAST.ETS, enable users to predict future trends based on historical data. What is AI in Excel?
Introduction In today’s data-driven landscape, analytics shapes business strategies and outcomes. Organisations leverage analytical capabilities to transform raw data into actionable insights, driving informed decision-making and fostering innovation.
How will we manage all this information? The popular tools, on the other hand, include PowerBI, ETL, IBM Db2, and Teradata. What’s more interesting, however, are the trends formed as a result of the newer digitally-reliant solutions. They specifically help shape the industry, altering how business analysts work with data.
As organisations grapple with this vast amount of information, understanding the main components of Big Data becomes essential for leveraging its potential effectively. As organisations collect vast amounts of information from various sources, ensuring data quality becomes critical.
As organisations grapple with this vast amount of information, understanding the main components of Big Data becomes essential for leveraging its potential effectively. As organisations collect vast amounts of information from various sources, ensuring data quality becomes critical.
From building a data science team to harnessing cutting-edge tools, this cheat sheet equips you to unlock the hidden potential of your data and make informed decisions. Data Science Cheat Sheet for Business Leaders In today’s data-driven world, information is power. But raw data itself isn’t enough.
This framework includes components like data sources, integration, storage, analysis, visualization, and information delivery. By implementing a robust BI architecture, businesses can make informed decisions, optimize operations, and gain a competitive edge in their industries.
Business Intelligence (BI) refers to the technology, techniques, and practises that are used to gather, evaluate, and present information about an organisation in order to assist decision-making and generate effective administrative action. Based on the report of Zion Research, the global market of Business Intelligence rose from $16.33
Data privacy regulations will shape how organisations handle sensitive information in analytics. According to recent statistics, 56% of healthcare organisations have adopted predictiveanalytics to improve patient outcomes. In retail, customer behaviour analysis informs inventory management and marketing strategies.
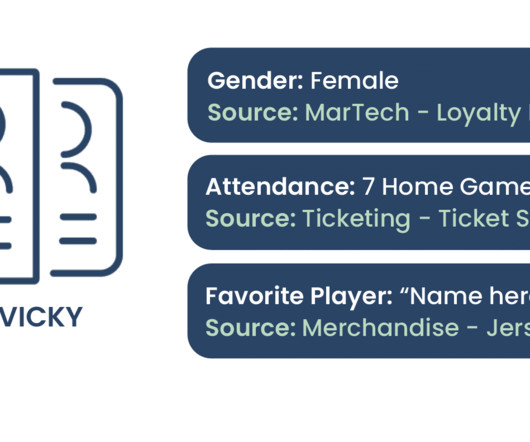
With terms like ‘Fan 360’ disrupting the industry, there’s never been a better time to harness your fanbase to make more informed decisions. These features make Snowflake an excellent destination for fan data sources with fluctuating data storage or processing needs, such as ticketing, forms & surveys, and CRM funneling information.
Importance of Tableau Tableau is used by different industries and organisations that helps in collecting large amount of datasets and therefore, using the data to interpret meaningful information. It further helps in understanding the information better and utilise it for effective decision-making.
PredictiveAnalytics This forecasts future trends based on past data; businesses use it to anticipate customer demand, stock market trends, or product performance. For example, a weather app predicts rainfall using past climate data. For instance, hospitals use analytics to monitor patient outcomes and optimize treatment plans.
Data Science is analyzing vast amounts of patient information to predict diseases before they strike, personalize treatment plans based on individual needs, and streamline healthcare operations. This data deluge encompasses electronic health records, medical imaging results, genetic information, and even data from wearable devices.
The Power of Machine Learning and AI in Data Science Machine Learning (ML) and AI are integral components of Data Science that enable systems to learn from data without explicit programming. Key skills include programming (Python/R), statistical analysis, Machine Learning, data visualization (Tableau/PowerBI), and domain knowledge.
Moreover, its ability to integrate seamlessly with Microsoft tools (Office 365, Teams, PowerBI) and third-party applications makes collaboration and data access much easier. Moreover, integration with PowerBI provides advanced reporting capabilities, offering visual insights into financial metrics.
We organize all of the trending information in your field so you don't have to. Join 17,000+ users and stay up to date on the latest articles your peers are reading.
You know about us, now we want to get to know you!
Let's personalize your content
Let's get even more personalized
We recognize your account from another site in our network, please click 'Send Email' below to continue with verifying your account and setting a password.


Let's personalize your content