This site uses cookies to improve your experience. To help us insure we adhere to various privacy regulations, please select your country/region of residence. If you do not select a country, we will assume you are from the United States. Select your Cookie Settings or view our Privacy Policy and Terms of Use.
Cookie Settings
Cookies and similar technologies are used on this website for proper function of the website, for tracking performance analytics and for marketing purposes. We and some of our third-party providers may use cookie data for various purposes. Please review the cookie settings below and choose your preference.
Used for the proper function of the website
Used for monitoring website traffic and interactions
Cookie Settings
Cookies and similar technologies are used on this website for proper function of the website, for tracking performance analytics and for marketing purposes. We and some of our third-party providers may use cookie data for various purposes. Please review the cookie settings below and choose your preference.
Strictly Necessary: Used for the proper function of the website
Performance/Analytics: Used for monitoring website traffic and interactions
Efficient decision-making is the result of combining information, analysis, and effectiveness. Power BI and Tableau, popular and user-friendly data visualization tools, help businesses organize large datasets. That’s why businesses of all types and sizes are embracing data visualization, albeit often with a simplified approach.
Introduction In the world of data analytics, where every piece of information holds untapped potential, the ability to transform raw data into actionable insights is a game-changer. Tableau, a dynamic and versatile data visualization tool, has revolutionized how organizations harness the power of their data.
Tableau is a leader in the analytics market, known for helping organizations see and understand their data, but we recognize that gaps still exist: while many of our joint customers already benefit from dbt and trust the metrics that result from these workflows, they are often disconnected and obscured from Tableau’s analytics layer.
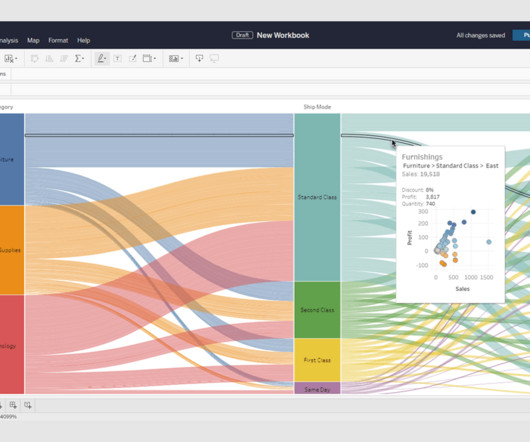
This feature was inspired by the New Chart Type Pilot on Tableau Public in spring 2023, where we saw excitement from our DataFam in how new visualizations were introduced. We wanted to empower the community to play an active role in the designing and developing their own viz types they use in Tableau. What are Viz Extensions?
Think your customers will pay more for data visualizations in your application? Five years ago they may have. But today, dashboards and visualizations have become table stakes. Discover which features will differentiate your application and maximize the ROI of your embedded analytics. Brought to you by Logi Analytics.
National Solutions Engineer, Tableau . For more on this subject, I highly recommend the blog Micaela mentions, Information is beautiful , or Colors and their meaning around the world from K-International.com for some general guidelines on improving accessibility, including but not limited to, the use of color. Mark Bradbourne.
Tableau has been on a long journey to provide natural language interfaces for analytics. We are truly excited about Tableau Pulse , launched in a wide beta in December 2023 and planned for general availability in Tableau 2024.1. In 2020, Metrics in Tableau launched.
Technical Fellow, Tableau. Tableau has been helping people and organizations to see and understand data for almost two decades, bringing exciting innovations to the landscape of business intelligence with every product release. I am proud to announce that my History of Tableau Innovation viz is now published to Tableau Public.
Spencer Czapiewski September 12, 2024 - 8:38pm Karen Madera Senior Manager, Product Marketing, Tableau We’re in the midst of an autonomous revolution that’s reshaping the way businesses use data to gain a competitive edge, delight customers, and engage employees. View the demo to see Tableau Einstein in action: What is Tableau Einstein?
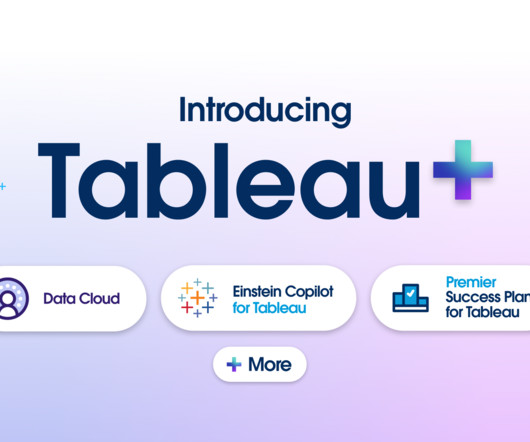
Kristin Adderson June 11, 2024 - 4:53pm Noel Carter Senior Product Marketing Manager, Tableau Evan Slotnick Product Management Director, Tableau At the Tableau Conference 2024 keynote , Tableau CEO Ryan Aytay spoke about the new wave of analytics: the consumerization of data. That’s why we created Tableau+.
Technical Evangelist Director, Tableau. Zen Master Steve Wexler has been blogging about survey data longer than most people have been using Tableau. ( Tableau Zen Master Steve Wexler once used a “classic” divergent stacked bar approach. Process descriptions like this are extremely informative as we develop our own skills.
Product Manager, Tableau. The Extension Gallery that you know and love is now the Tableau Exchange and it has an even greater mission. The Tableau Exchange is your one-stop-shop for offerings to jumpstart your data analysis to answer questions and get actionable data quickly. What are Tableau Accelerators? . Pierce Young.
It’s one of our guiding principles at Tableau and why we support students and instructors around the globe through Tableau Academic Programs. When I first joined the Tableau Academic Programs Team in 2017, many professors would refer me to their Computer Science or Statistics department. Data skills are also interdisciplinary.
Chief Product Officer, Tableau. It's more important than ever in this all digital, work from anywhere world for organizations to use data to make informed decisions. Tableau and Google Cloud are partnering to help modernize your data and analytics infrastructure and unlock your data’s full value. Francois Ajenstat.
Kristin Adderson September 8, 2023 - 2:29am September 12, 2023 At Dreamforce 2023, the Tableau keynote was packed with innovations that will empower everyone as we charge ahead into the AI Revolution. Regardless of your role, department, or industry, Tableau is your trusted partner for your data and AI journey.
Drumroll, please: Nominations and applications for the 2021 Tableau Ambassador Program are now open! The incalculable impact of the 2020 Tableau Ambassadors. Tableau Ambassadors were everywhere, even when many were at home in quarantine. Tableau Ambassadors were everywhere, even when many were at home in quarantine.
Product Manager, Tableau. First thing’s first: I am thrilled to announce that Tableau’s analytics extensions are now available in Tableau Online! Starting with R integration in Tableau 8.3, All of these steps have led up to support for integrating Python, R, and other analytics extensions in Tableau Online.
Ateken Abla March 19, 2024 - 9:05pm Larissa Amoroso Vice President, Tableau Community, Tableau When Karolina Grodzinska took the stage at Tableau Conference as part of her Iron Viz: Student Edition award, it felt like the culmination of her data learning, which started in 2021. How did Karolina discover Tableau? “It
Tableau Academic Programs Instructional Designer. Those experiences not only informed my teaching, but it became a personal passion to bring foundational data skills to all. That’s why I was thrilled to join the Tableau Academic team, which understands the importance of bringing these data literacy skills to students.
Data visualization is the art of presenting complex information in a way that is easy to understand and analyze. It allows businesses to quickly and easily understand large amounts of complex information, identify patterns, and make data-driven decisions. Keep it simple Simplicity is key when it comes to data visualization.
Technical Evangelist Director, Tableau. The Flerlage Twins take a longer view and look at their ten favourite Tableau Public vizzes of all time. Click to view their full visualization on Tableau Public. With that, enjoy Best of the Tableau Web with tips, tricks, inspiration and more produced by the Tableau community.
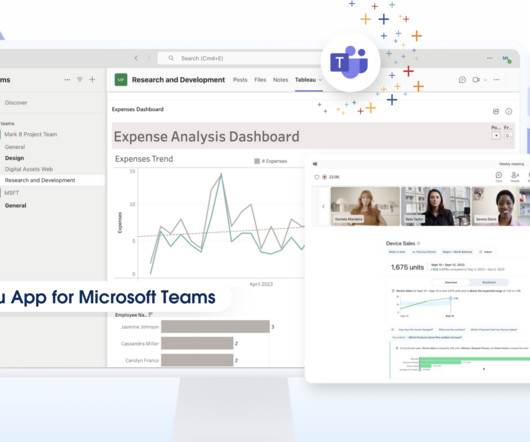
At Tableau Conference, we reaffirmed our commitment to helping everyone see, understand, and act on data, and our desire to bring data and analytics to everyone, everywhere. While many of our customers use Tableau alongside Microsoft Teams, these workflows have been disconnected.
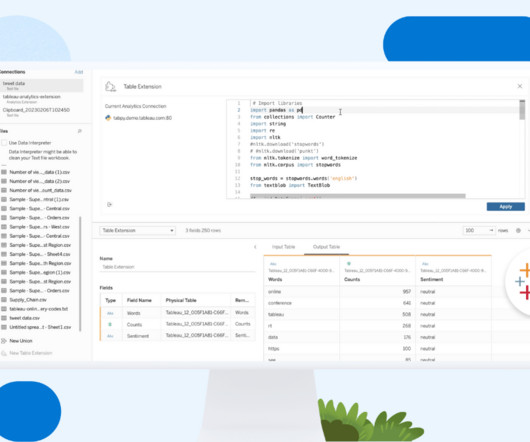
However, true return on investment is realized only when these models are used to leverage insights and make informed decisions that drive tangible value for the organization. At the root, an Analytics Extension is a server that you stand up to receive data from Tableau in real-time. Analytics Extensions do just that!
Social Media and Blog Specialist, Tableau. Tableau Ambassadors teach and share while fostering a positive and supportive space within the data community. Tableau Ambassadors serve one-year terms in one of seven branches: Forums, User Groups, Student, DataDev, Public, Social, and CRM Analytics. Bronwen Boyd. Britt Staniar.
Community Manager, Tableau. I’m Caroline Yam, Tableau Community Manager based down under in Sydney, Australia, and I’m thrilled to join the ranks of the Best of Tableau Web authors. . To finish the program, participants are asked to share their Tableau knowledge to benefit the broader community and themselves. Hi DataFam!
Community Manager, Tableau. I’m Caroline Yam, Tableau Community Manager based down under in Sydney, Australia, and I’m thrilled to join the ranks of the Best of Tableau Web authors. . To finish the program, participants are asked to share their Tableau knowledge to benefit the broader community and themselves. Hi DataFam!
Salesforce’s Tableau business unit today announced the 2023.1 release of its enterprise platform known as Tableau Server, which can run on-premises or in an organization’s own … Data can be complicated to collect and it is often even more complex to understand in a way that brings a business value.
Product Marketing Associate, Tableau. The Tableau 2022.2 To learn more, read Test Row-Level Security with Preview as User in Tableau Help. Streamline authentication with Tableau Bridge. Tableau Bridge communicates with your Tableau Cloud site from behind your firewall to keep your published data sources fresh.
National Solutions Engineer, Tableau . Welcome to the Best of the Tableau Web! Each month we showcase the amazing outputs from the Tableau Community, including blogs, podcasts, and even videos. Tableau Desktop . The sequel, Innovative Tableau is just as fantastic. . Tableau Prep and Tableau Server.
National Solutions Engineer, Tableau . Welcome to the Best of the Tableau Web! Each month we showcase the amazing outputs from the Tableau Community, including blogs, podcasts, and even videos. Tableau Desktop . The sequel, Innovative Tableau is just as fantastic. . Tableau Prep and Tableau Server.
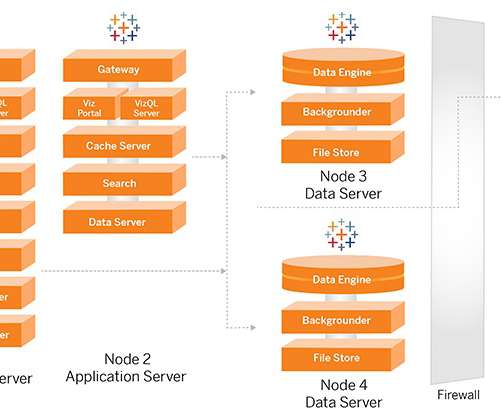
Senior Manager, Product Marketing, Tableau. The Tableau 2022.1 Architect Tableau Server across subnets with Enterprise Deployment Guidelines. For Tableau Server in version 2021.2.3 To get started, read Tableau Server Enterprise Deployment Guide in Tableau Help. Tableau 2022.1 Bronwen Boyd.
Senior Manager, Product Marketing, Tableau. The Tableau 2022.1 Architect Tableau Server across subnets with Enterprise Deployment Guidelines. For Tableau Server in version 2021.2.3 To get started, read Tableau Server Enterprise Deployment Guide in Tableau Help. Tableau 2022.1 Bronwen Boyd.
Technical Evangelist Director, Tableau. The Flerlage Twins take a longer view and look at their ten favourite Tableau Public vizzes of all time. Click to view their full visualization on Tableau Public. With that, enjoy Best of the Tableau Web with tips, tricks, inspiration and more produced by the Tableau community.
Britt Staniar Senior Community Program Manager, Recognition Programs Ateken Abla June 12, 2023 - 10:41pm June 14, 2023 Nominations and applications for the 2023 Tableau Ambassador Program are now open. What do Tableau Ambassadors do? Finally, Tableau Ambassadors advocate for under-represented voices within our community.
Product Marketing Associate, Tableau. The Tableau 2022.2 To learn more, read Test Row-Level Security with Preview as User in Tableau Help. Streamline authentication with Tableau Bridge. Tableau Bridge communicates with your Tableau Cloud site from behind your firewall to keep your published data sources fresh.
Product Manager, Tableau. Every day, patients place their trust in healthcare providers, payers, and other medical professionals to help safeguard their health information, including as required by the Health Insurance Portability and Accountability Act (HIPAA). What is HIPAA and how does it impact Tableau Cloud? Sheng Zhou.
Product Manager, Tableau. Every day, patients place their trust in healthcare providers, payers, and other medical professionals to help safeguard their health information, including as required by the Health Insurance Portability and Accountability Act (HIPAA). What is HIPAA and how does it impact Tableau Cloud? Sheng Zhou.
Nominations and applications for the 2022 Tableau Ambassador Program are now open. What do Tableau Ambassadors do? Tableau Ambassadors are leaders in our community and data champions who want to bring analytics to everyone. Learn more about the Tableau Ambassadors on our website. Already know it all? Otherwise, read on.
Brand Marketing Intern at Tableau, A Salesforce Company. From crafting questions for interviews and surveys, to cleaning my research data and examining it in Tableau, I needed to understand data formatting and collection. Gabby Isaguirre. Kristin Adderson. October 6, 2021 - 7:01am. September 17, 2021.
Product Manager, Tableau. At Tableau, Trust is our number one value , and we continually strive to improve the trust that you have in us by improving the security and data compliance suite for our flagship SaaS product, Tableau Cloud. How Does It Affect SaaS Providers Like Tableau? Tableau and TISAX. Bronwen Boyd.
Product Manager, Tableau. At Tableau, Trust is our number one value , and we continually strive to improve the trust that you have in us by improving the security and data compliance suite for our flagship SaaS product, Tableau Cloud. How Does It Affect SaaS Providers Like Tableau? Tableau and TISAX. Bronwen Boyd.
Britt Staniar Senior Community Program Manager, Recognition Programs Brittni McCafferty Community Global Program Manager – User Groups Sarah Molina March 3, 2023 - 9:04pm March 4, 2023 Tableau Ambassadors teach and share while fostering a positive and supportive space within the community. What do Tableau User Group Ambassadors do?
Kuber Sharma Director, Product Marketing, Tableau Kristin Adderson August 22, 2023 - 12:11am August 22, 2023 Whether you're a novice data analyst exploring the possibilities of Tableau or a leader with years of experience using VizQL to gain advanced insights—this is your list of key Tableau features you should know, from A to Z.
Sarah Molina Corporate Marketing Analyst Sarah Molina February 1, 2023 - 9:50pm February 4, 2023 Tableau Public is a free online visual analytics platform that allows you to learn and practice data skills, create and explore data visualizations, discover data stories, and create your own portfolio of work to share with your network.
We organize all of the trending information in your field so you don't have to. Join 17,000+ users and stay up to date on the latest articles your peers are reading.
You know about us, now we want to get to know you!
Let's personalize your content
Let's get even more personalized
We recognize your account from another site in our network, please click 'Send Email' below to continue with verifying your account and setting a password.


Let's personalize your content