This site uses cookies to improve your experience. To help us insure we adhere to various privacy regulations, please select your country/region of residence. If you do not select a country, we will assume you are from the United States. Select your Cookie Settings or view our Privacy Policy and Terms of Use.
Cookie Settings
Cookies and similar technologies are used on this website for proper function of the website, for tracking performance analytics and for marketing purposes. We and some of our third-party providers may use cookie data for various purposes. Please review the cookie settings below and choose your preference.
Used for the proper function of the website
Used for monitoring website traffic and interactions
Cookie Settings
Cookies and similar technologies are used on this website for proper function of the website, for tracking performance analytics and for marketing purposes. We and some of our third-party providers may use cookie data for various purposes. Please review the cookie settings below and choose your preference.
Strictly Necessary: Used for the proper function of the website
Performance/Analytics: Used for monitoring website traffic and interactions
Applied Machine Learning Scientist Description : Applied ML Scientists focus on translating algorithms into scalable, real-world applications. Demand for applied ML scientists remains high, as more companies focus on AI-driven solutions for scalability.
Introduction The world is transforming by AI, ML, Blockchain, and Data Science drastically, and hence its community is growing rapidly. So, to provide our community with the knowledge they need to master these domains, Analytics Vidhya has launched its DataHour sessions.
Microsoft PowerBI with Copilot Microsoft PowerBI has integrated genAI through its Copilot feature , transforming how users interact with data. The Copilot in PowerBI allows users to generate reports, visualizations, and insights using natural language queries, making advanced analytics accessible to a broader audience.
By harnessing the power of machine learning (ML) and natural language processing (NLP), businesses can streamline their data analysis processes and make more informed decisions. Augmented analytics is the integration of ML and NLP technologies aimed at automating several aspects of data preparation and analysis.
Business Analytics requires business acumen; Data Science demands technical expertise in coding and ML. Dashboards, such as those built using Tableau or PowerBI , provide real-time visualizations that help track key performance indicators (KPIs). Data Scientists require a robust technical foundation.
And as the next step, the data is sent to such leading-edge BI tools, as Google Data Studio, PowerBI, Oracle BI, Tableau, etc., ML algorithms analyze dozens of metrics and connections between them and consequently stop fraudulent traffic. The use of AI in affiliate marketing.
Managed services like AWS Lambda and Azure Data Factory streamline data pipeline creation, while pre-built ML models in GCPs AI Hub reduce development time. Visualisation tools like PowerBI (Azure) and Looker (GCP) offer intuitive reporting interfaces, while AWS integrates Tableau for diverse visualisation needs.
Tools like Tableau, Matplotlib, Seaborn, or PowerBI can be incredibly helpful. Learn relevant tools Familiarize yourself with data science tools and platforms, such as Tableau for data visualization, or Hadoop for big data processing. This is where data visualization comes in.
Leverage Tools for Enhanced Data Analysis Evolve beyond basic tools like Excel by exploring advanced platforms such as PowerBI, Tableau, or even Python for more intricate analyses. PowerBI and Tableau can create interactive dashboards that users can easily play with data.
Expertise in tools like PowerBI, SQL, and Python is crucial. Expertise in programs like Microsoft Excel, SQL , and business intelligence (BI) tools like PowerBI or Tableau allows analysts to process and visualise data efficiently. AI and automation play a central role in the evolving role.
Experience with visualization tools like; Tableau and PowerBI. High proficiency in visualization tools like; Tableau, Google Studio, and PowerBI. Knowledge of big data platforms like; Hadoop and Apache Spark. Basic programming knowledge in R or Python.
This could involve using tools like Tableau or PowerBI to create visualizations and dashboards. This could involve using tools like Apache Spark or Apache Flink to perform data transformations, analytics, and machine learning. Secure the data : Data security is a critical part of any big data architecture blueprint.
One set of tools that are becoming more important in our data-driven world is BI tools. Think of Tableau, PowerBI, and QlikView. This allows for it to be integrated with many different tools and technologies to improve data management and analysis workflows.
Data Analytics Platforms: Tableau, PowerBI, Looker, Alteryx, Google Analytics, SPSS, SAP, Pandas. The most common trend shouldn’t come as a surprise, as the most in-demand data analytics platforms revolve around reporting, such as Tableau, PowerBI, Looker, Alteryx, Google Analytics, SPSS, and SAP.
Along with Tableau, the curriculum also provides supervised and unsupervised learning opportunities. In effect, the Certified Data Science professional programme includes topics like Data Analysis and Visualisation, ML models, Predictive models , NLP etc.
Users like to see the data directly and manipulate the data using published programs like Tableau, PowerBI, or whatever URL site you select (it could be a google sheet or a github repository transformed into a github page). WARNING that some code snippets MIGHT not work ? It was very easy to setup!
Machine Learning (ML) is a subset of AI that involves using statistical techniques to enable machines to improve their performance on tasks through experience. On the other hand, ML focuses specifically on developing algorithms that allow machines to learn and make predictions or decisions based on data.
The rise of advanced technologies such as Artificial Intelligence (AI), Machine Learning (ML) , and Big Data analytics is reshaping industries and creating new opportunities for Data Scientists. Learn to use tools like Tableau, PowerBI, or Matplotlib to create compelling visual representations of data.
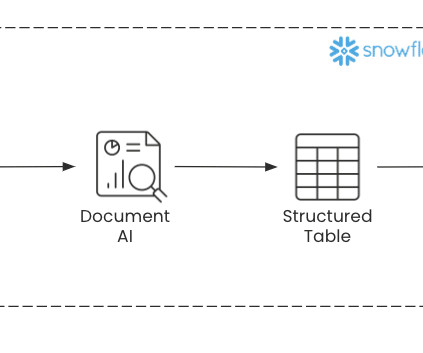
By harnessing the advancements of LLMs, users can now extract key information buried within large documents without any code or ML knowledge required. Before diving into the technology that powers Document AI, let’s go over some of the utility that extracting your information offers. Why is Document AI Important?
Here is the tabular representation of the same: Technical Skills Non-technical Skills Programming Languages: Python, SQL, R Good written and oral communication Data Analysis: Pandas, Matplotlib, Numpy, Seaborn Ability to work in a team ML Algorithms: Regression Classification, Decision Trees, Regression Analysis Problem-solving capability Big Data: (..)
Moreover, tools like PowerBI and Tableau can produce remarkable results. For instance, feature engineering and exploratory data analysis (EDA) often require the use of visualization libraries like Matplotlib and Seaborn. These tools can be employed later on to automate tasks and create a smoother workflow.
Step 2: Analyze the Data Once you have centralized your data, use a business intelligence tool like Sigma Computing , PowerBI , Tableau , or another to craft analytics dashboards. It also leads to more company-wide collaboration and cuts unnecessary organizational expenses.
Principal ML Prototyping Solutions Architect at AWS Tamil Jayakumar is a Sr. Principal Enterprise Architect at CBRE Chakra Nagarajan is a Sr. Prototyping Engineer at AWS Shane Madigan is a Sr. Engagement Manager at AWS Maran Chandrasekaran is a Sr. Solutions Architect at AWS VB Bakre is an Account Manager at AWS
Here are some of the most essential elements of Data Science: Machine Learning (ML): Helps computers learn from data and make predictions without direct programming; powers recommendation systems like those on Netflix or Amazon. Tableau and PowerBI : Visualisation tools that create interactive dashboards and reports.
As MLOps become more relevant to ML demand for strong software architecture skills will increase aswell. Machine Learning As machine learning is one of the most notable disciplines under data science, most employers are looking to build a team to work on ML fundamentals like algorithms, automation, and so on.
I can make html/javascript webpages, code in javascript/html, I used python flask, streamlite, deployed google script coded figures to http endpoints, used numerous visualization/app programs like Tableau/PowerBI/Looker, and made many API endpoints.
The Power of Machine Learning and AI in Data Science Machine Learning (ML) and AI are integral components of Data Science that enable systems to learn from data without explicit programming. Example: Netflix uses ML to recommend shows based on viewing history. Example: Netflix uses ML to recommend shows based on viewing history.
20212024: Interest declined as deep learning and pre-trained models took over, automating many tasks previously handled by classical ML techniques. This shift suggests that while traditional ML is still relevant, its role is now more supportive rather than cutting-edge.
We organize all of the trending information in your field so you don't have to. Join 17,000+ users and stay up to date on the latest articles your peers are reading.
You know about us, now we want to get to know you!
Let's personalize your content
Let's get even more personalized
We recognize your account from another site in our network, please click 'Send Email' below to continue with verifying your account and setting a password.


Let's personalize your content