This site uses cookies to improve your experience. To help us insure we adhere to various privacy regulations, please select your country/region of residence. If you do not select a country, we will assume you are from the United States. Select your Cookie Settings or view our Privacy Policy and Terms of Use.
Cookie Settings
Cookies and similar technologies are used on this website for proper function of the website, for tracking performance analytics and for marketing purposes. We and some of our third-party providers may use cookie data for various purposes. Please review the cookie settings below and choose your preference.
Used for the proper function of the website
Used for monitoring website traffic and interactions
Cookie Settings
Cookies and similar technologies are used on this website for proper function of the website, for tracking performance analytics and for marketing purposes. We and some of our third-party providers may use cookie data for various purposes. Please review the cookie settings below and choose your preference.
Strictly Necessary: Used for the proper function of the website
Performance/Analytics: Used for monitoring website traffic and interactions
NaturalLanguage Query (NLQ) is changing the way we interact with data analytics by allowing users to speak or type their questions in a way that feels natural and intuitive. What is NaturalLanguage Query (NLQ)? Applications of NLQ NLQ finds its applications across various sectors, illustrating its versatility.
For instance, Berkeley’s Division of Data Science and Information points out that entry level data science jobs remote in healthcare involves skills in NLP (NaturalLanguageProcessing) for patient and genomic data analysis, whereas remote data science jobs in finance leans more on skills in risk modeling and quantitative analysis.
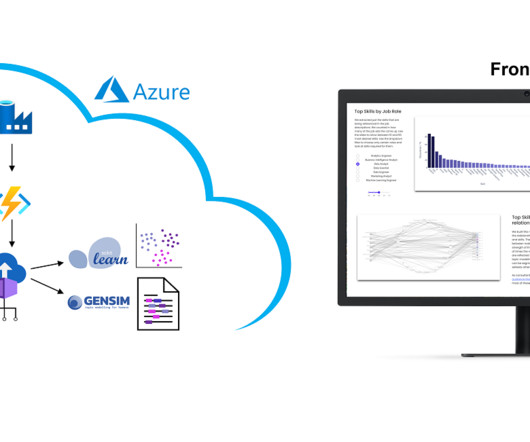
The data is obtained from the Internet via APIs and web scraping, and the job titles and the skills listed in them are identified and extracted from them using NaturalLanguageProcessing (NLP) or more specific from Named-Entity Recognition (NER). Why we did it? It is a nice show-case many people are interested in.
NaturalLanguageProcessing (NLP) for Data Interaction Generative AI models like GPT-4 utilize transformer architectures to understand and generate human-like text based on a given context. Generative AI for Data Analytics – Top 7 Tools to Leverage 1. ” and the Copilot will generate a relevant chart or report.
Explore, analyze, and visualize data with our Introduction to PowerBI training & make data-driven decisions. 2. Getting Started with SQL Programming: Are you starting your journey in data science? Then you’re probably already familiar with SQL, Python, and R for data analysis and machine learning.
Summary: PowerBI is a business analytics tool transforming data into actionable insights. Key features include AI-powered analytics, extensive data connectivity, customisation options, and robust data modelling. It offers AI-driven analytics, including NaturalLanguageProcessing. Why PowerBI?
Summary: PowerBI is a business intelligence tool that transforms raw data into actionable insights. PowerBI enhances decision-making by providing interactive dashboards and reports that are accessible to both technical and non-technical users. What Is PowerBI?
Key Tools and Techniques Business Analytics employs various tools and techniques to process and interpret data effectively. Dashboards, such as those built using Tableau or PowerBI , provide real-time visualizations that help track key performance indicators (KPIs). Data Scientists require a robust technical foundation.
Tools like Tableau, PowerBI, and Python libraries such as Matplotlib and Seaborn are commonly taught. Data Processing and Analysis : Techniques for data cleaning, manipulation, and analysis using libraries such as Pandas and Numpy in Python. R : Often used for statistical analysis and data visualization.
. – Microsoft Process Mining ist der relative Sieger in Sachen Aufholjagd mit ihrer eigenen Lösung (die zum Teil auf dem eingekauften Tool namens Minit basiert). Process Mining wurde kürzlich in die Power Automate Plattform und in PowerBI integriert. – Fluxicon (Disco) ist vom Chart verschwunden.
Data preprocessing is a fundamental and essential step in the field of sentiment analysis, a prominent branch of naturallanguageprocessing (NLP). In recent weeks, Microsoft has included PowerBI in Microsoft Fabric , which it markets as the absolute solution for your data problems.
There is a plethora of BI tools available in the market today, with new ones being added yearly. Through a comparative analysis of some of the leading BI tools: Google Looker, Microsoft PowerBI, Tableau and Qlik Sense, discover which BI solution best fits your organization’s data analytics needs to empower informed decision-making.
NaturalLanguageProcessing (NLP) allows machines to understand and generate human language, enhancing interactions between humans and machines. Practical skills in SQL, Python, and Machine Learning. Algorithms, the step-by-step calculation procedures, form the foundation of both fields.
Enhanced Data Visualisation: Augmented analytics tools often incorporate naturallanguageprocessing (NLP), allowing users to query data in conversational terms and receive visualised insights instantly. Develop Programming Skills Proficiency in programming languages is crucial for Data Scientists.
While knowing Python, R, and SQL is expected, youll need to go beyond that. NaturalLanguageProcessing (NLP) has emerged as a dominant area, with tasks like sentiment analysis, machine translation, and chatbot development leading the way. Employers arent just looking for people who can program.
Tools and Technologies Python/R: Popular programming languages for data analysis and machine learning. SQL (Structured Query Language): Language for managing and querying relational databases. Tableau/PowerBI: Visualization tools for creating interactive and informative data visualizations.
You should be skilled in programming languages such as Python, R, or SQL , which are commonly used for data manipulation and analysis. Azure Synapse Analytics Previously known as Azure SQL Data Warehouse , Azure Synapse Analytics offers a limitless analytics service that combines big data and data warehousing.
We organize all of the trending information in your field so you don't have to. Join 17,000+ users and stay up to date on the latest articles your peers are reading.
You know about us, now we want to get to know you!
Let's personalize your content
Let's get even more personalized
We recognize your account from another site in our network, please click 'Send Email' below to continue with verifying your account and setting a password.


Let's personalize your content